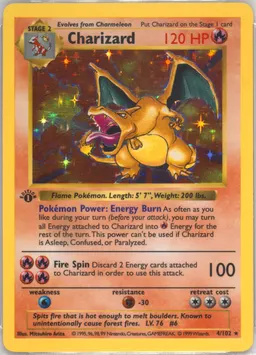


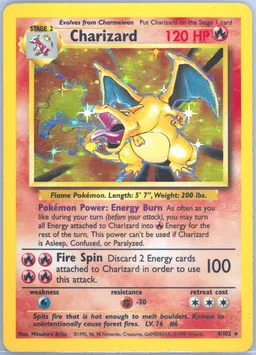





Top holdings
by weight- Charizard ex · PSA 1036.7%
- Charizard ex · PSA 916.7%
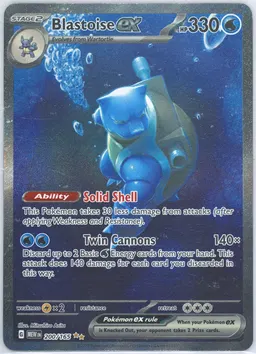
- Blastoise ex · PSA 109.2%
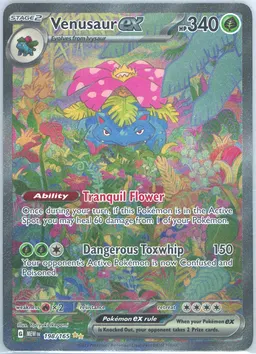
- Venusaur ex · PSA 106.3%
- Charizard ex · PSA 85.8%
Top 5 hold 74.7% of index weight across 28 constituents.
Index value over time
Weekly index level. Pro members can view and export the complete recorded history. Constituents are cap-weighted with the divisor reset on each monthly rebalance.
Constituents
Every atom in the index, cap-weighted and dampened by sales evidence. Follow a card name to drill into the underlying card detail.
- 1Charizard ex- Special Illustration Rare · PSA 10 · $39.09M36.7%↑0.5%
- 2Charizard ex- Special Illustration Rare · PSA 9 · $17.78M16.7%↓1.4%
- 3Blastoise ex- Special Illustration Rare · PSA 10 · $9.78M9.2%↓0.9%
- 4Venusaur ex- Special Illustration Rare · PSA 10 · $6.75M6.3%↑0.1%
- 5Charizard ex- Special Illustration Rare · PSA 8 · $6.15M5.8%↓0.9%
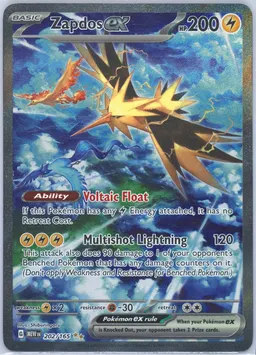
- 6Zapdos ex- Special Illustration Rare · PSA 10 · $5.52M5.2%↑0.6%
- 7Blastoise ex- Special Illustration Rare · PSA 9 · $4.37M4.1%↓1.1%
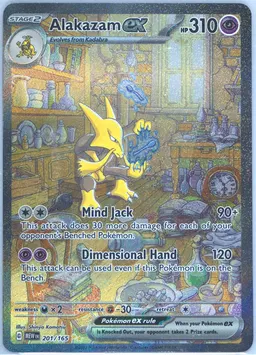
- 8Alakazam ex- Special Illustration Rare · PSA 10 · $3.64M3.4%·0.0%
- 9Venusaur ex- Special Illustration Rare · PSA 9 · $3.22M3.0%↑0.9%
- 10Zapdos ex- Special Illustration Rare · PSA 9 · $2.44M2.3%↑0.6%
- 11Alakazam ex- Special Illustration Rare · PSA 9 · $1.41M1.3%↓0.2%
- 12Blastoise ex- Special Illustration Rare · PSA 8 · $1.31M1.2%↑1.8%
- 13Charizard ex- Special Illustration Rare · PSA 7 · $1.15M1.1%↓0.1%
- 14Venusaur ex- Special Illustration Rare · PSA 8 · $934.7K0.9%↑0.3%
- 15Zapdos ex- Special Illustration Rare · PSA 8 · $722.2K0.7%↓0.1%
- 16Giovanni's Charisma- Special Illustration Rare · PSA 10 · $431.7K0.4%↓3.3%
- 17Erika's Invitation- Special Illustration Rare · PSA 10 · $431.7K0.4%↓2.2%
- 18Alakazam ex- Special Illustration Rare · PSA 8 · $423.4K0.4%↓0.7%
- 19Blastoise ex- Special Illustration Rare · PSA 7 · $176.9K0.2%↓3.3%
- 20Erika's Invitation- Special Illustration Rare · PSA 9 · $176.3K0.2%↑0.2%
Rebalances
Most recent weekly rebalance events. The divisor is reset on each event so the index level remains continuous through composition changes; subsequent moves are price-driven.
- Sep 26, 2026divisor1,131,357→1,131,358Δcap0.0%Added (0)NoneRemoved (0)None
- Sep 19, 2026divisor1,134,718→1,131,249Δcap0.3%Added (0)NoneRemoved (0)None
- Sep 13, 2026divisor1,131,060→1,133,719Δcap0.2%Added (0)NoneRemoved (0)None
- Sep 5, 2026divisor1,131,060→1,131,060Δcap0.0%Added (0)NoneRemoved (0)None
- Aug 29, 2026divisor1,127,446→1,128,347Δcap0.1%Added (0)NoneRemoved (0)None
- Aug 22, 2026divisor1,146,004→1,124,419Δcap1.9%Added (0)NoneRemoved (0)None
Methodology
Cap-weighted from confidence-scored fair values, rebalanced monthly with continuous divisor accounting.
Read the full methodologyParent set
Cap-weighted, with each constituent dampened by the sales evidence behind its fair value so noisy inputs move the index less. Weekly rebalances with continuous-divisor accounting, so population growth and membership changes never move the level: only price action does. A constituent needs a fair value and a non-zero graded population; sales evidence adjusts its weight rather than gating its inclusion. Per-grade series isolate one tier, composites span PSA 7-10. All values are USD-denominated, base 100 at inception.
Related
Other indices that share this print run or this grade tier, plus the parent set.


