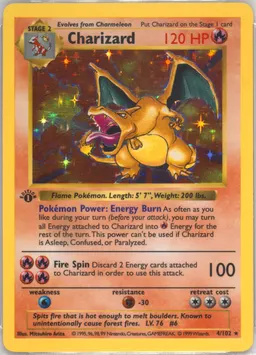



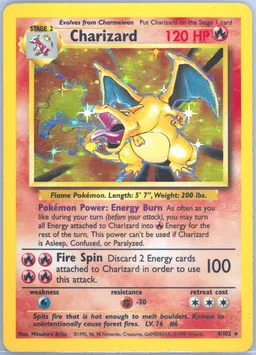









Do Scarcer Pokémon Sets Move More?
Does a smaller graded population make a Pokémon set more likely to move sharply?
TCGBerg Research Desk
Published 5 MIN read
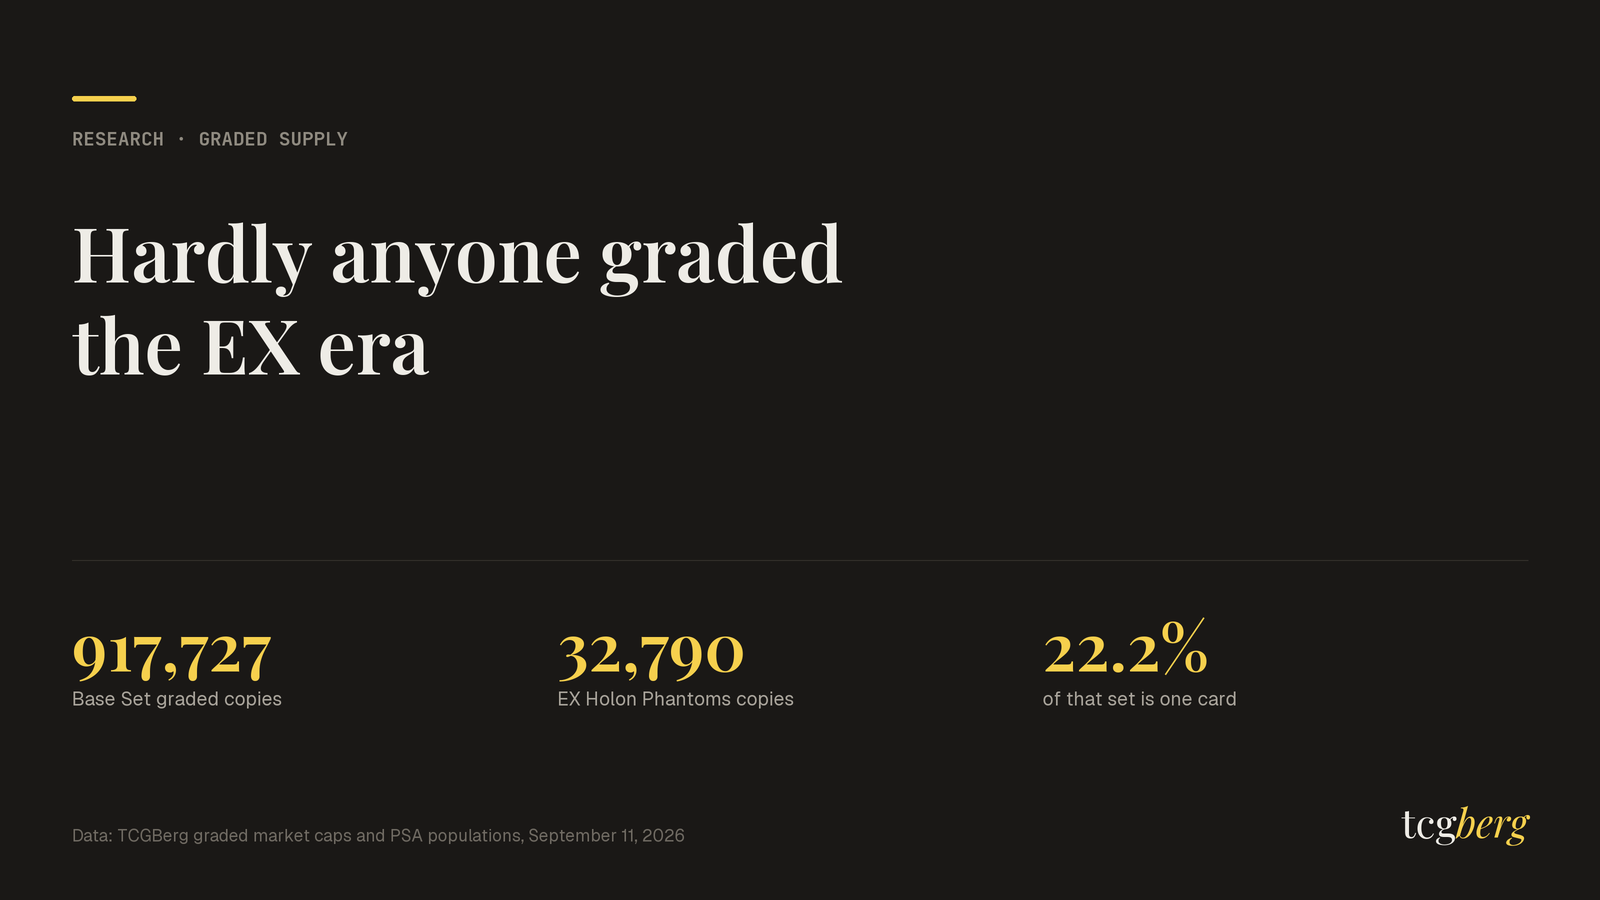
To find out, we compared the graded population of 143 Pokémon sets with their change in total graded market capitalisation over the last 30 days.
The pattern was clear, if imperfect. The fifth of sets with the fewest graded copies rose by a median 6.5%, while the fifth with the most copies fell 1.8%. The thinly graded EX era, covering 2003–2007, gained a median 14.2%.
But thin supply cuts both ways. It can make prices move faster, while also making those prices harder to trust.
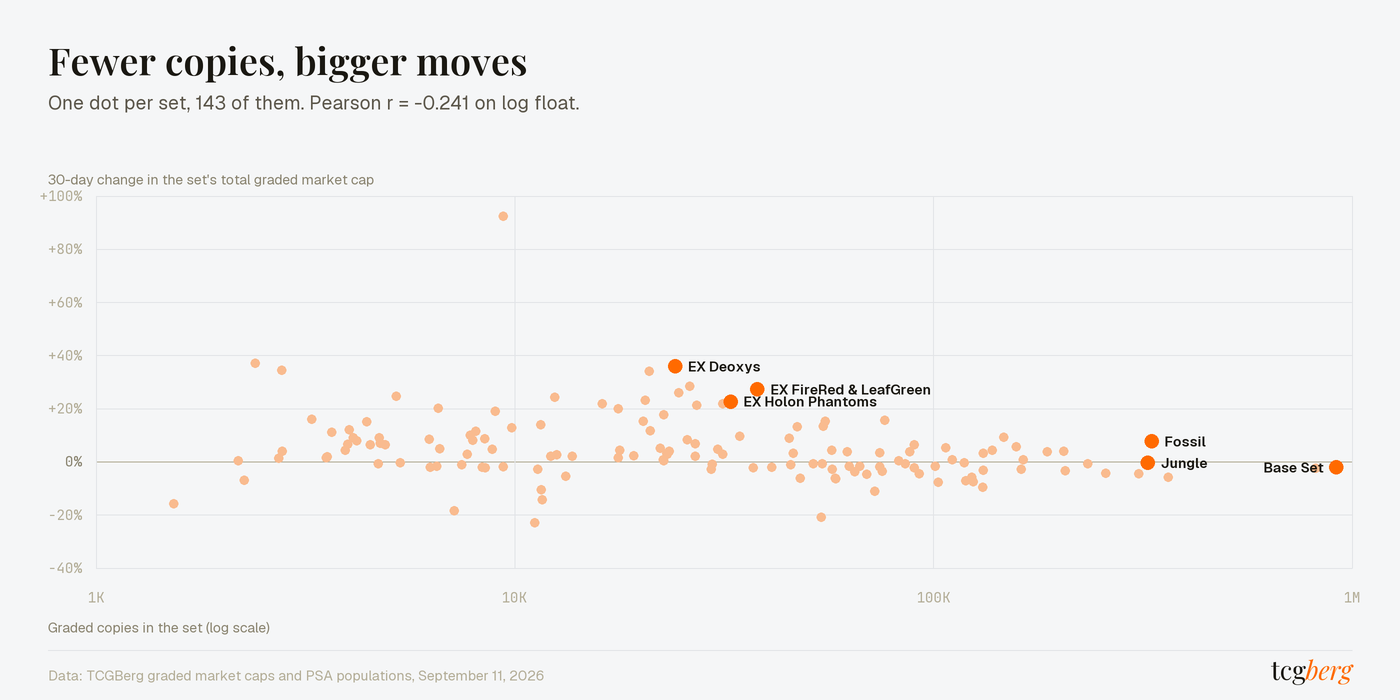
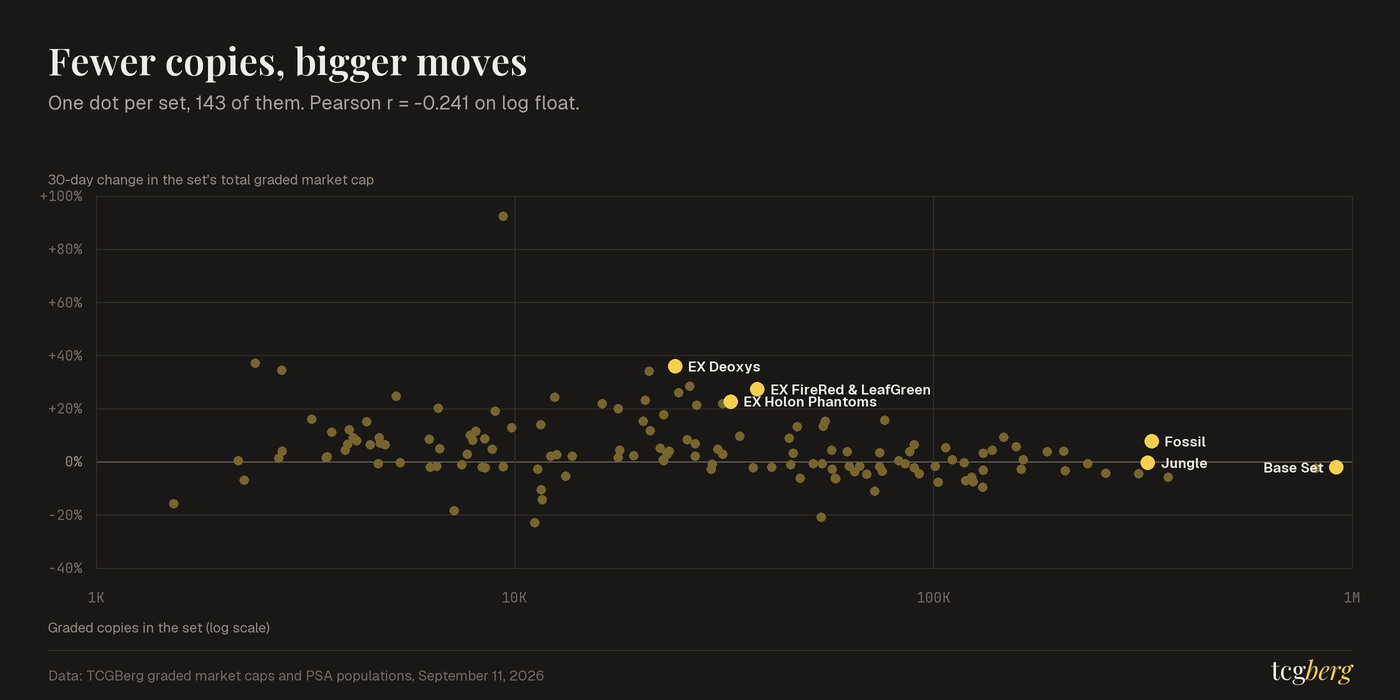
Fewer copies, bigger moves
A set’s graded float is the total number of graded copies across every card in that set. It comes directly from grading-company population reports rather than from our valuation model. It is the closest equivalent this market has to a share count.
Across the 143 sets, graded float ranged from just 1,532 copies to 917,727 for Base Set. When we compared float with each set’s 30-day market-cap change, the relationship was negative: Pearson -0.241 on a logarithmic population scale.
Splitting the sets into fifths makes the pattern easier to see:
| Fifth by graded float | Median copies | Median 30-day change |
|---|---|---|
| Q1 fewest copies | 4,068 | 6.5% |
| Q2 | 9,617 | 2.7% |
| Q3 | 24,414 | 5.9% |
| Q4 | 57,825 | -1.0% |
| Q5 most copies | 138,135 | -1.8% |
This is not a perfect ladder: Q3 outperformed Q2. The data does not say that fewer copies always produce larger gains. It says that the three smallest groups rose, while the two largest were flat to down.
Could this simply be weak pricing evidence?
Thinly graded sets also tend to have fewer sales. That matters because a fair-value estimate based on limited evidence can jump when only a handful of new transactions arrive. If that explained the entire pattern, we would be measuring changes in our own model rather than changes in the market.
Average fair-value confidence had a correlation of -0.244 with the 30-day move, slightly stronger than float’s -0.241. Float and confidence were also related at 0.363.
When we controlled for each factor, both relationships remained but weakened: -0.169 for float and -0.173 for confidence. Those results alone could not separate a genuine supply effect from a measurement effect.
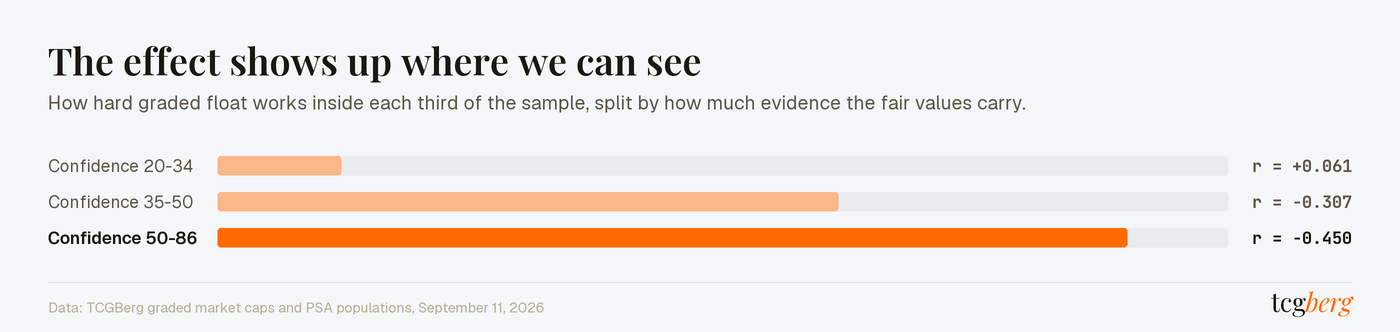
The relationship is strongest where the evidence is best
We therefore divided the sets by pricing confidence.
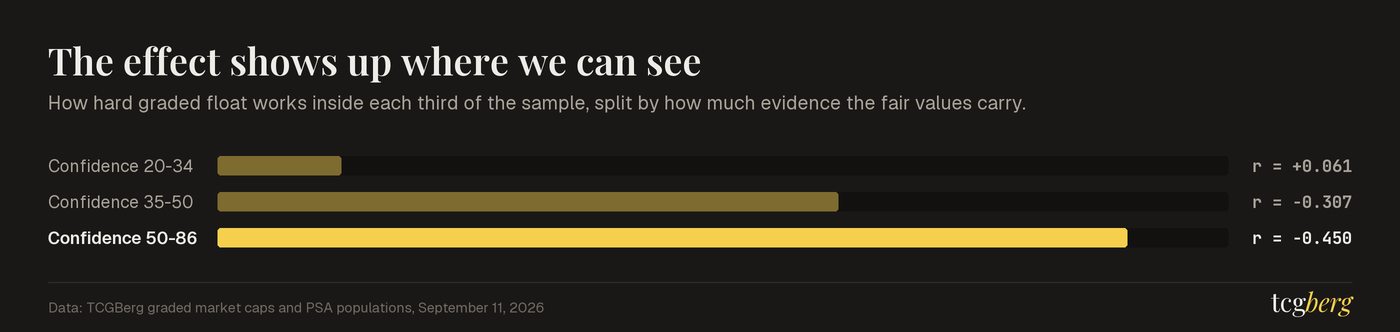
Among the 49 sets with the strongest evidence, float had a correlation of -0.450 with the 30-day move. In the middle group, it was -0.307. Among the 47 sets with the weakest evidence, it fell to 0.061 - effectively no relationship.
That makes the thin-float pattern more credible, because it is strongest where prices are supported by better data.
The awkward exception is the EX era. Its median confidence score is only 29.8, the lowest of any generation, compared with 60.2 for the newest sets.
So the EX era’s 14.2% gain is the headline figure we should trust least. Its small graded population, however, is directly observed and far more reliable.
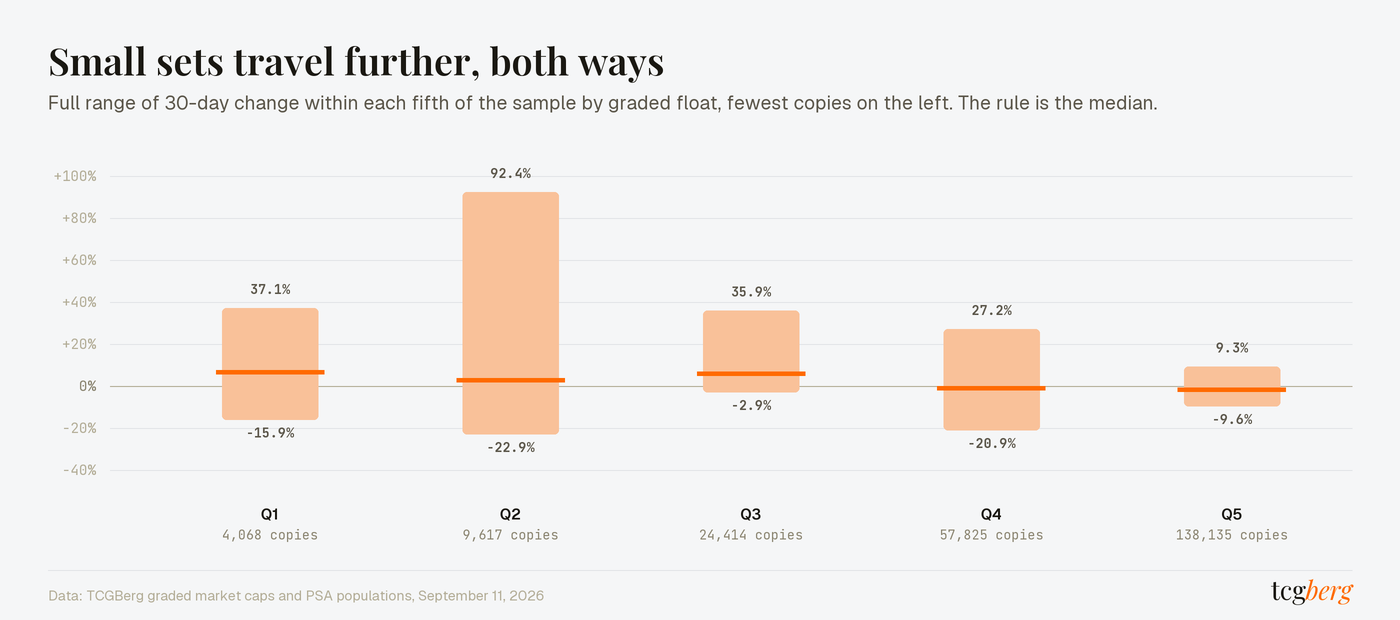
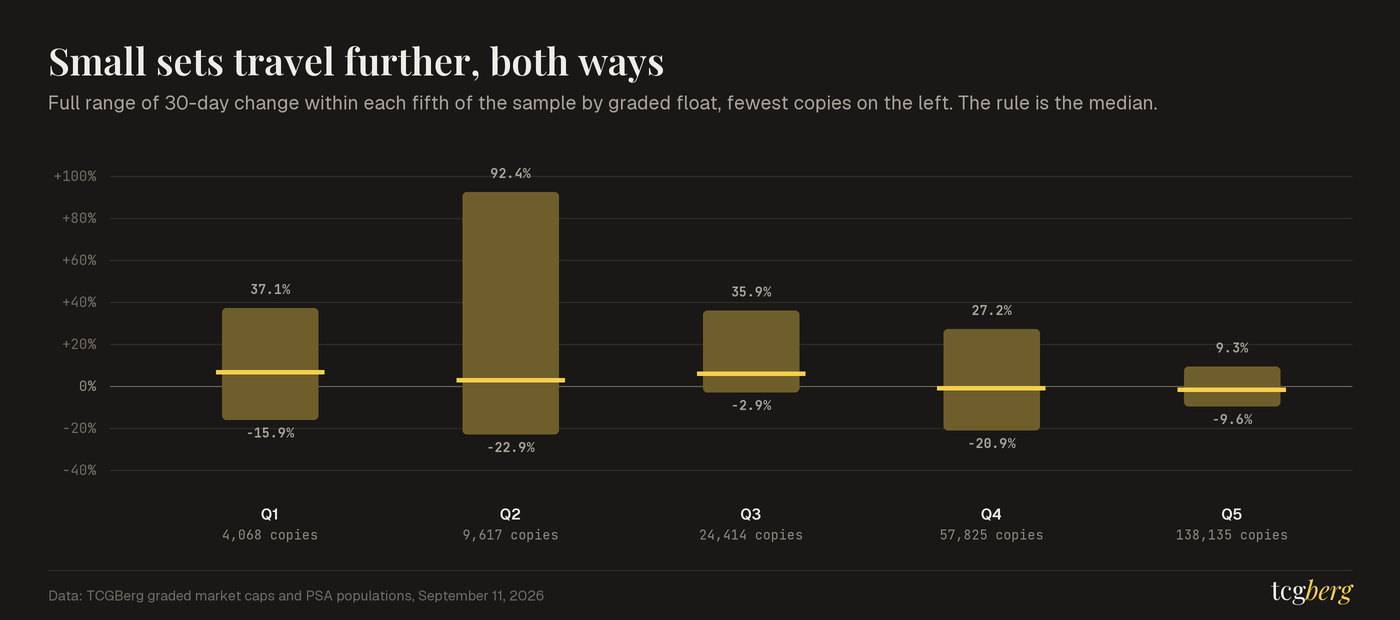
The range of outcomes tells the same story. In the smallest fifth, 30-day changes ran from -15.9% to +37.1%. In the largest fifth, they ranged from -9.6% to +9.3%.
A small float does not force prices higher. It simply allows them to travel further in either direction.
An EX set is basically three cards
Put the price moves aside for a minute and look at what the counts say on their own, because this is the solid ground.
An EX-era set is not a broad market with a few expensive cards in it. It is two or three cards with a set attached.
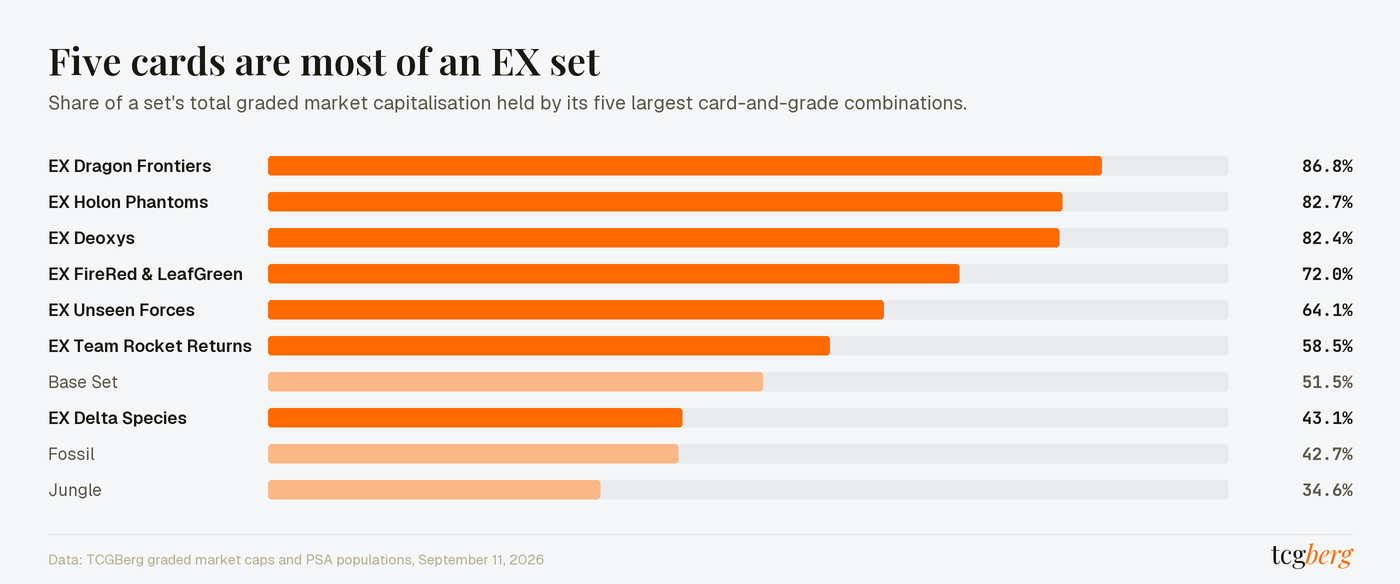
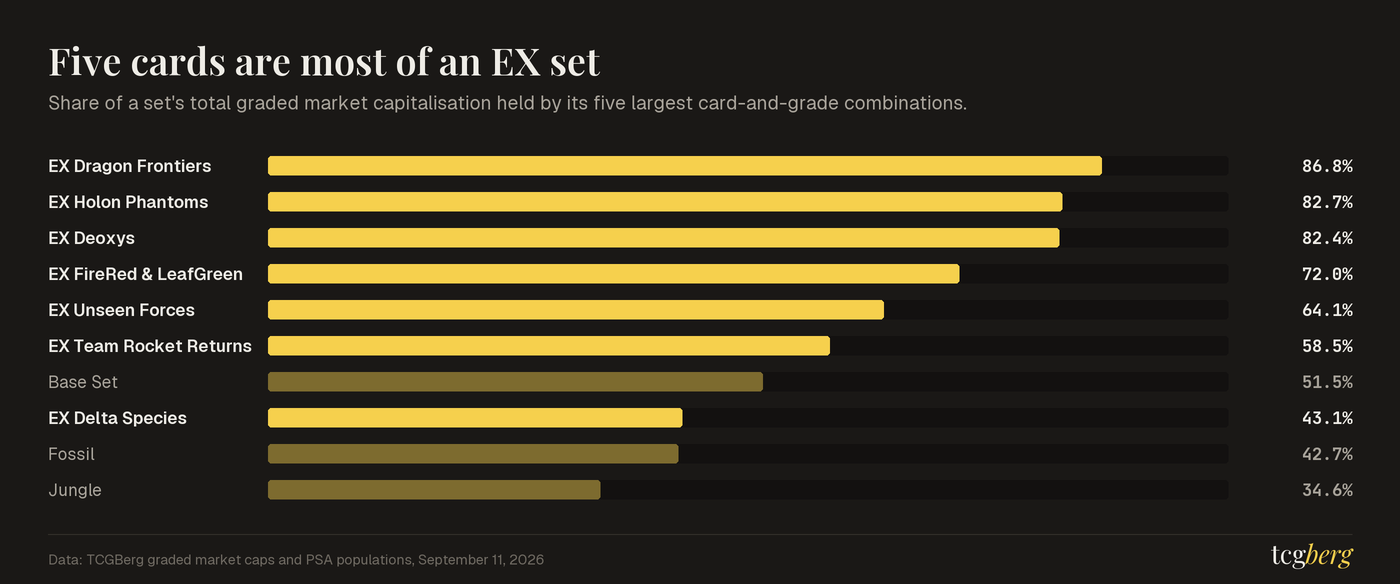
In EX Dragon Frontiers the five biggest card-and-grade combinations are 86.8% of what the whole set is worth. In EX Holon Phantoms, 82.7%. In EX Deoxys, 82.4%. Base Set is 51.5%, Fossil 42.7%, Jungle 34.6%.
| Set | Graded copies | Value per graded copy | Recorded sales, 30 days |
|---|---|---|---|
| EX Deoxys | 24,179 | $4,765 | 367 |
| EX Holon Phantoms | 32,790 | $4,005 | 409 |
| EX FireRed & LeafGreen | 38,011 | $1,668 | 408 |
| Jungle | 324,988 | $250 | 2,235 |
| Base Set | 917,727 | $681 | 4,456 |
Value per graded copy is the set's total graded market capitalisation divided by how many copies are slabbed. On that measure a graded EX Deoxys card carries about 19 times what a graded Jungle card carries, off roughly a sixth as many recorded sales.
The scarcity is real. The price may not be.
Go one level down and the whole argument states itself on a single card.
The Pikachu Gold Star from EX Holon Phantoms has 119 copies in PSA 10. That is a count, and you can go and check it. Our fair value on it is $245,203, and that is not a count. It carries a confidence score of 15 out of 100, it rests on 7 recorded sales in a year, 0 of them in the last 30 days, and the most recent real sale we hold, on 2026-06-22, went for $135,000. That is 44.9% under our own estimate.
The Rayquaza Gold Star is worse. 47 copies in PSA 10. Our estimate is $347,850, on a confidence score of 12, off exactly 1 recorded sale in the last year.
Now drop one grade on the same two cards. The Pikachu in PSA 9: 448 copies, an estimate of $26,625, 30 recorded sales in a year. The Rayquaza in PSA 9: 237 copies, an estimate of $106,109, a confidence score of 49, and a most recent sale at $108,000 that landed 1.8% from the estimate.
The float is still tiny. The evidence no longer is.
Cards in this story
| Card | Ticker | Fair value | 30D | Pop | Watch |
|---|---|---|---|---|---|
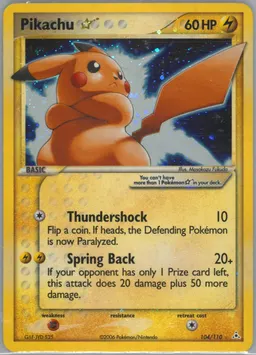 Pikachu Star #104EX Holon Phantoms Pikachu Star #104EX Holon Phantoms | EHP104E:EN | $225,004 | 2.5% | 119 | |
| Pikachu Star #104EX Holon Phantoms | EHP104E:EN | $30,864 | 39.0% | 449 | |
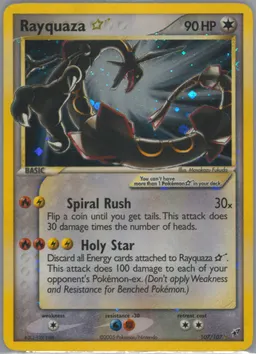 Rayquaza Star #107EX Deoxys Rayquaza Star #107EX Deoxys | DXY107E:EN | $568,943 | 82.0% | 47 | |
| Rayquaza Star #107EX Deoxys | DXY107E:EN | $119,820 | 24.3% | 237 |
What we would actually do with this
Thinly graded cards are where one new buyer can move the market. They are also where a headline valuation is most likely to be driven by sparse data.
For EX-era Gold Stars, the scarcity is often undeniable while the top-grade price remains uncertain. Grades with a few hundred copies and several dozen annual sales may therefore offer a more useful balance: still scarce, but supported by enough transactions to compare asking prices with what buyers have actually paid.
Before treating a price as a signal, open the card page and check the recorded sales beside the estimate. Pay particular attention to the confidence score. If a six-figure valuation rests on one sale, the honest conclusion is that nobody knows its precise value - including us.
Our fair-value methodology covers how the estimates and confidence scores are built. The sets board carries the float and concentration numbers for every set above. A watchlist follows the same atoms over time, which is the only way a 30-day number on a set that trades 367 times a month starts to mean anything.
Frequently asked
What is a set's graded float?
Does a small float mean a card will go up?
Why does the article distrust its own price estimates?
Article figures are fixed to the stated study date. Linked card pages and the market panels show newer data when available. TCGBerg fair values are modelled estimates with a sales-evidence rating, not quotes. Nothing here is financial advice. How fair value is computed. More from Research.