Find what is moving and where the market’s value sits. Movers, market caps, indices, and live deals, all from graded sales and live listings, refreshed daily.
26 cards listed below their TCGBerg fair value right now. Every card is a live eBay listing.
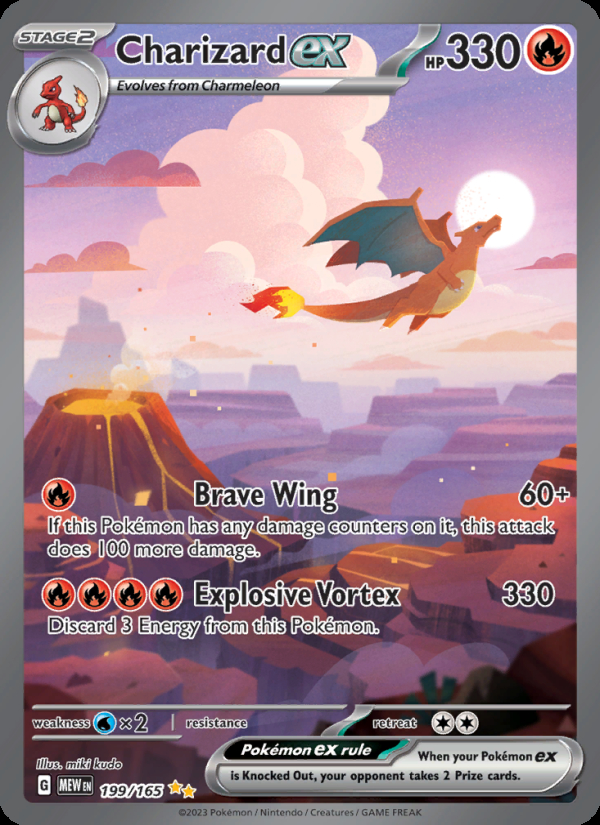
2023 Pokemon SV 151 Charizard ex Special Illustration Rare #199/165 PSA 10
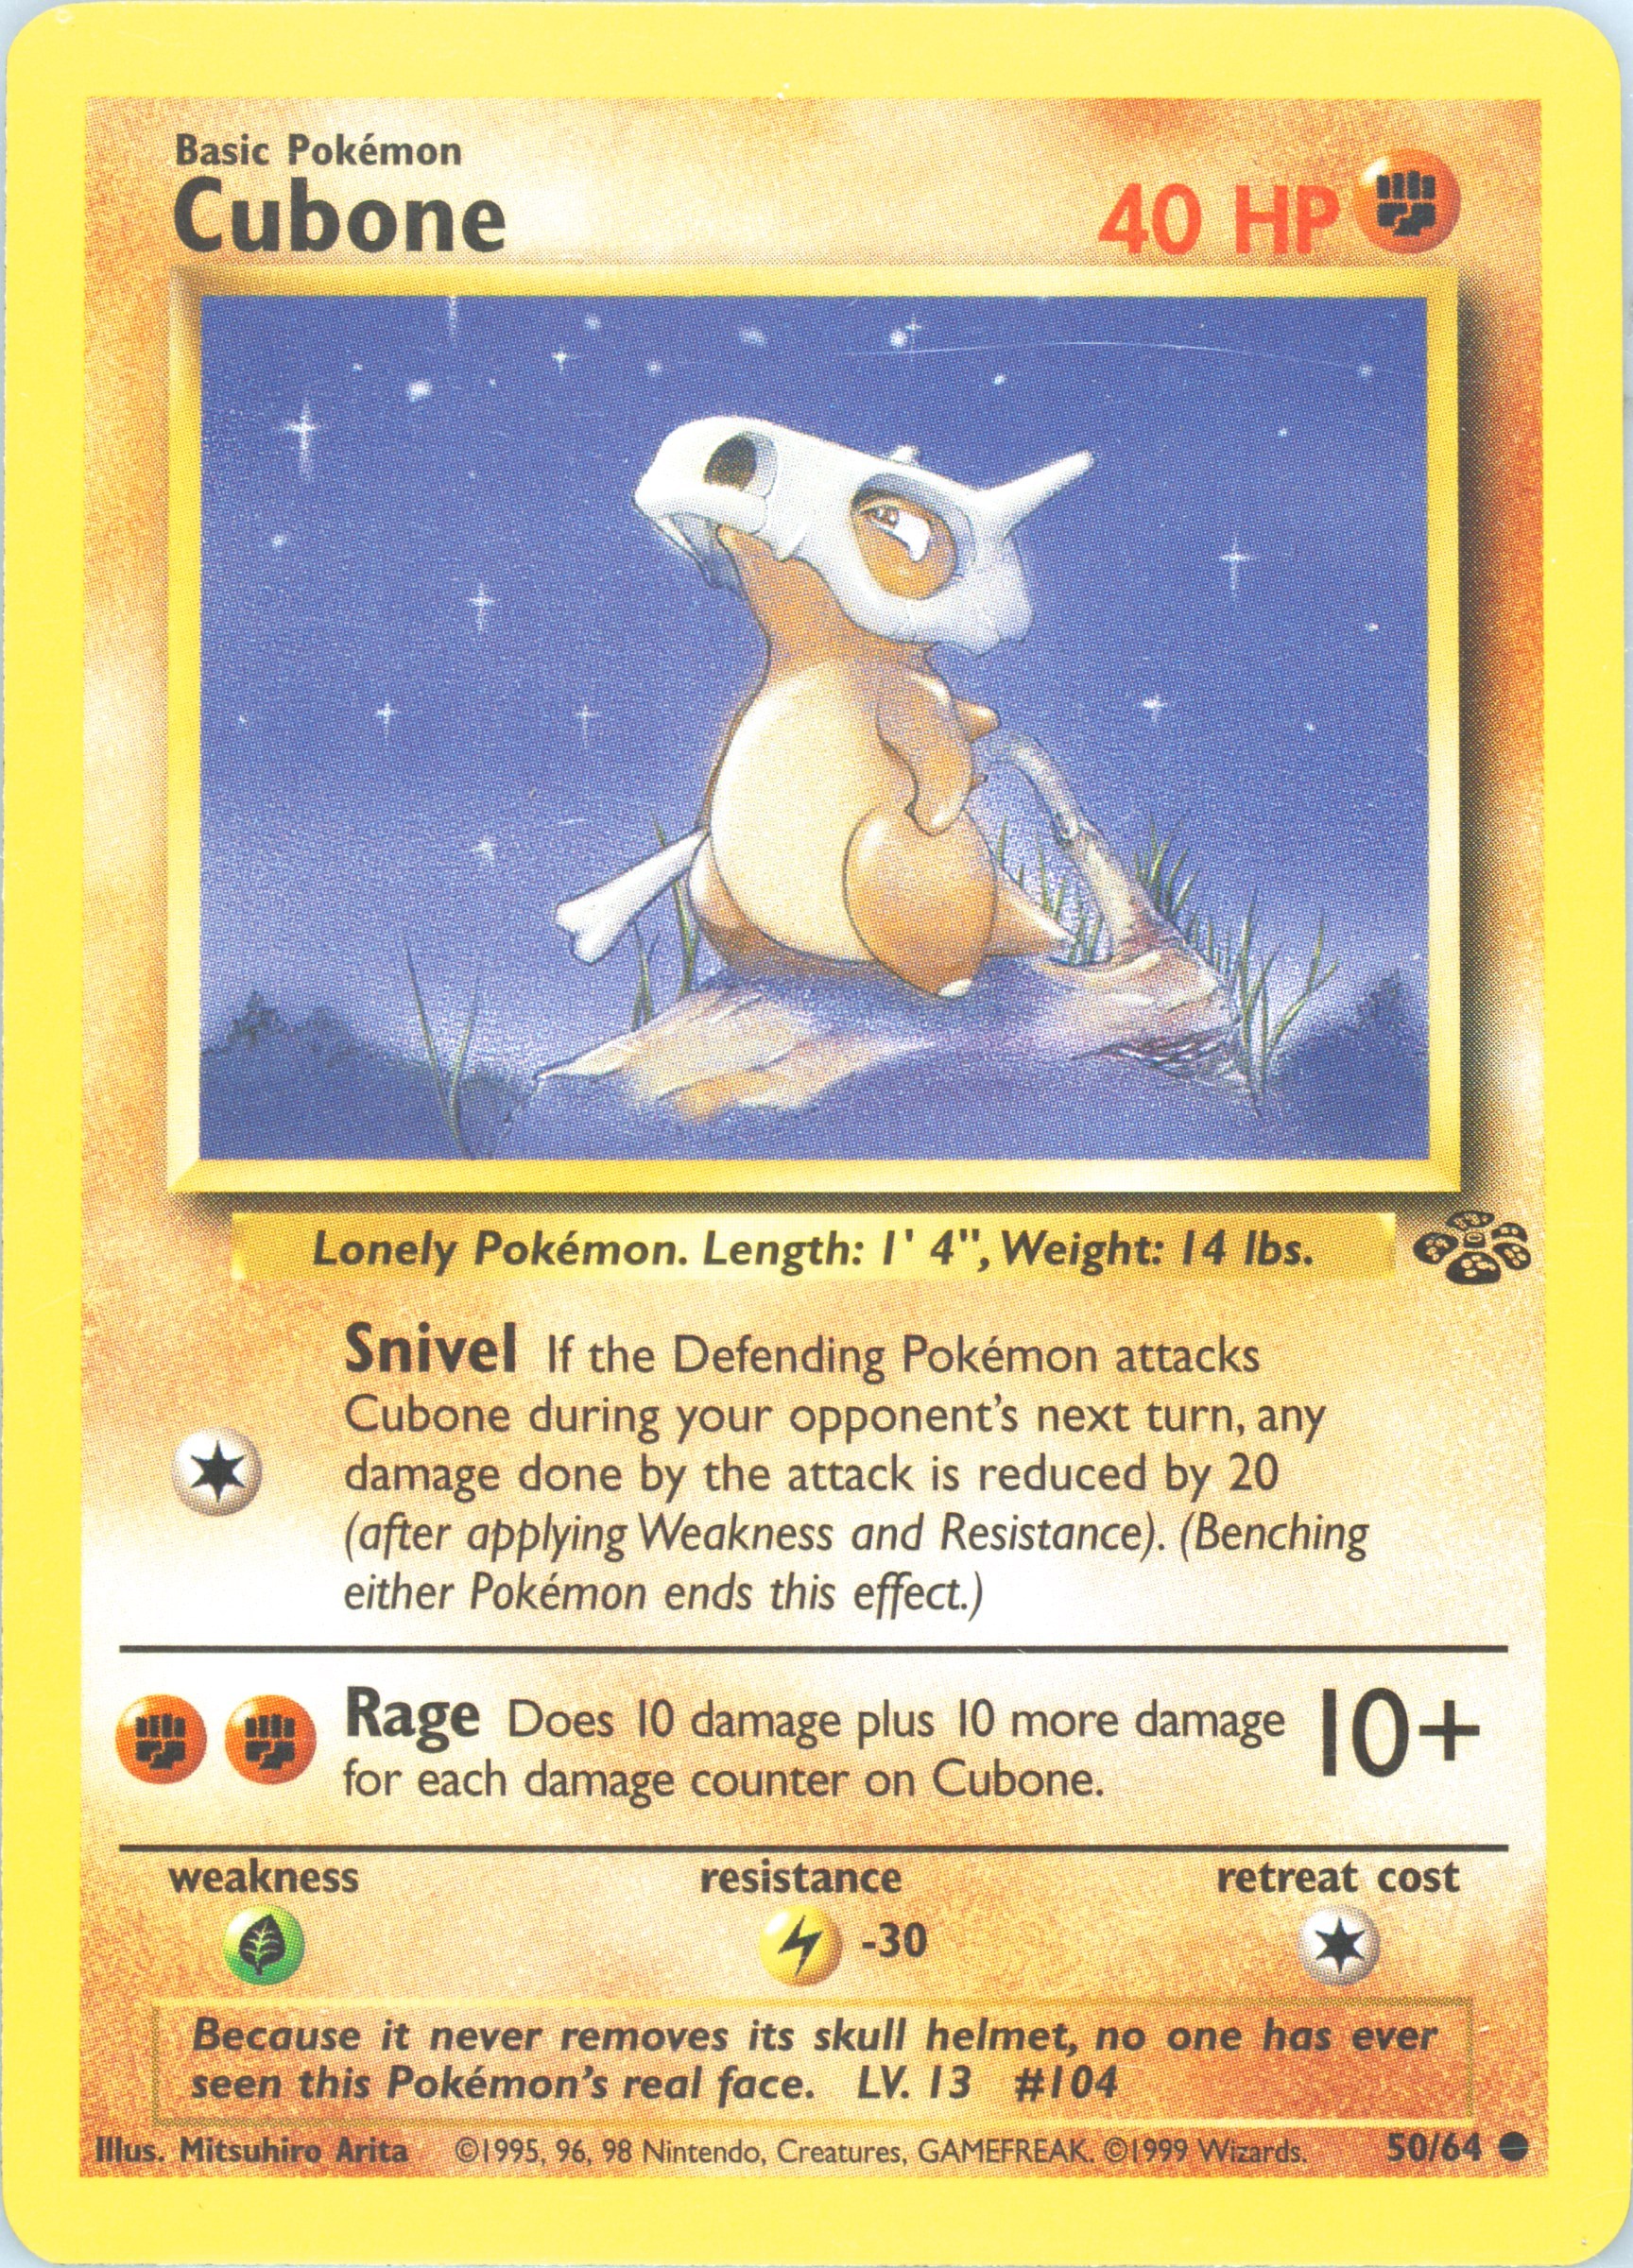
1999 WOTC POKEMON JUNGLE UNLIMITED CUBONE 50/64 COMMON PSA 10 GEM MINT

1999 WOTC POKEMON BASE SET UNLIMITED POLIWRATH 13/102 RARE HOLO FOIL PSA 10
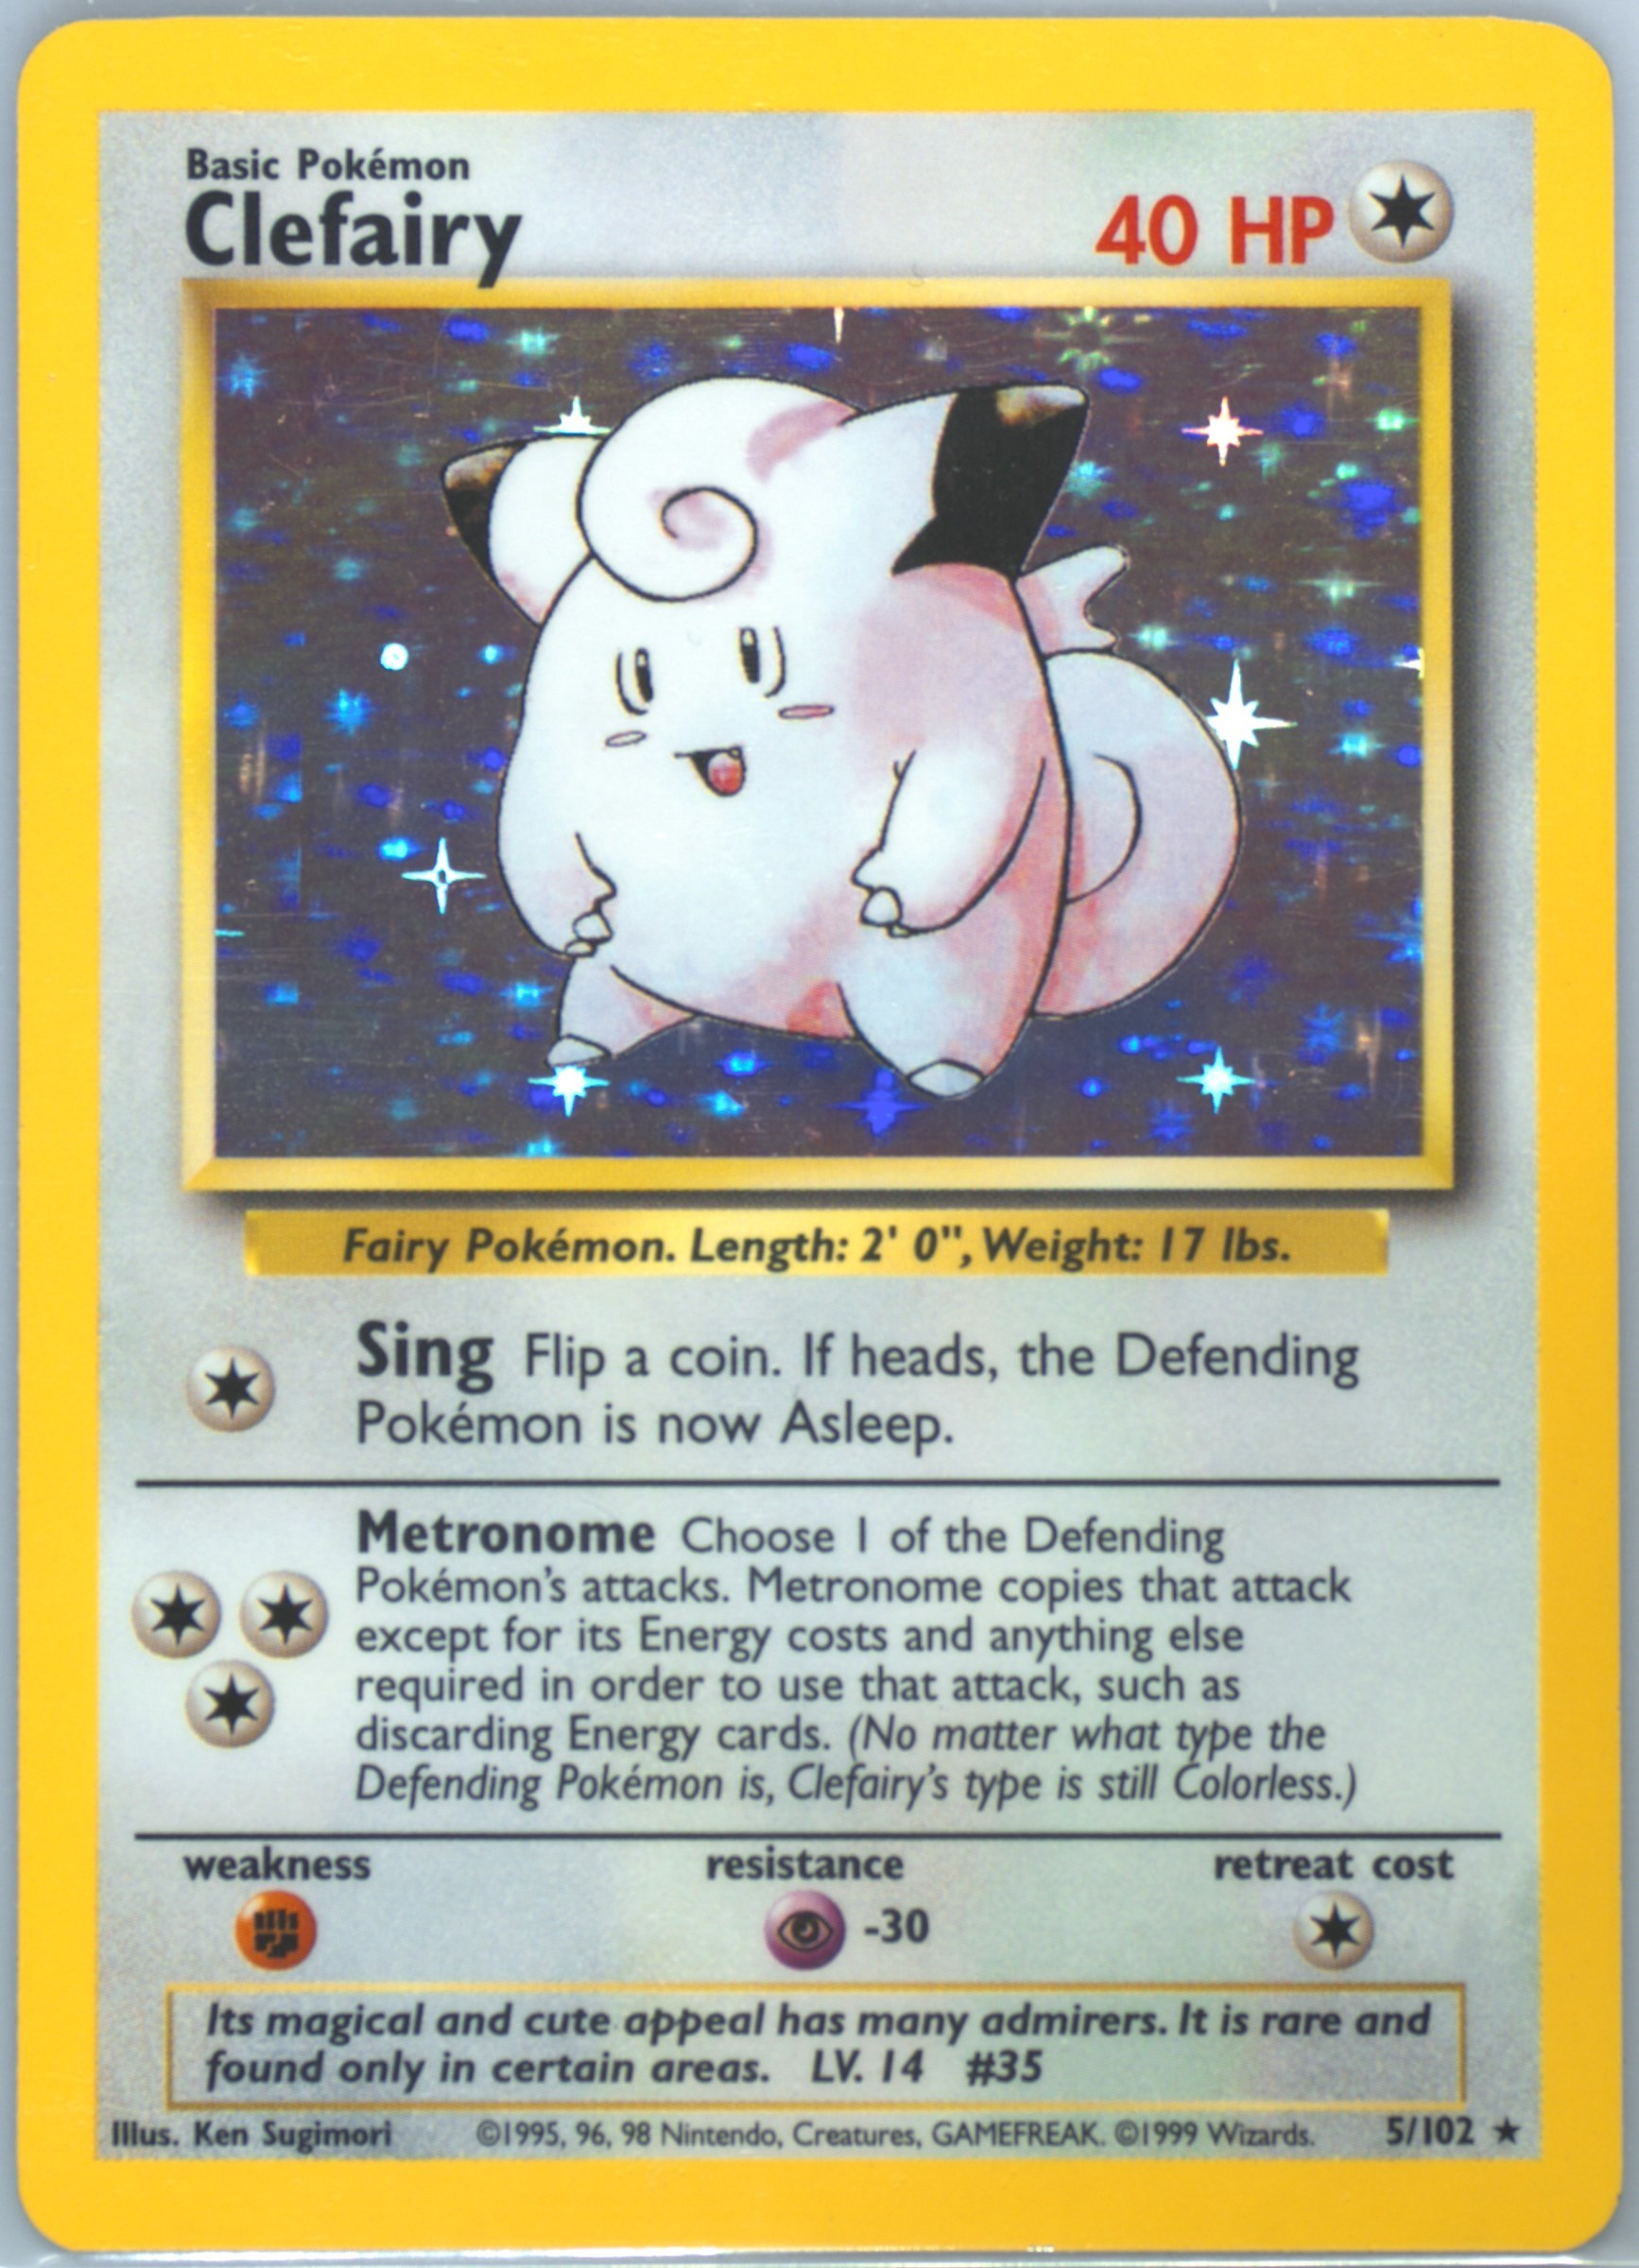
1999 WOTC POKEMON GAME BASE SET UNLIMITED CLEFAIRY #5/102 HOLO RARE PSA 9 MINT
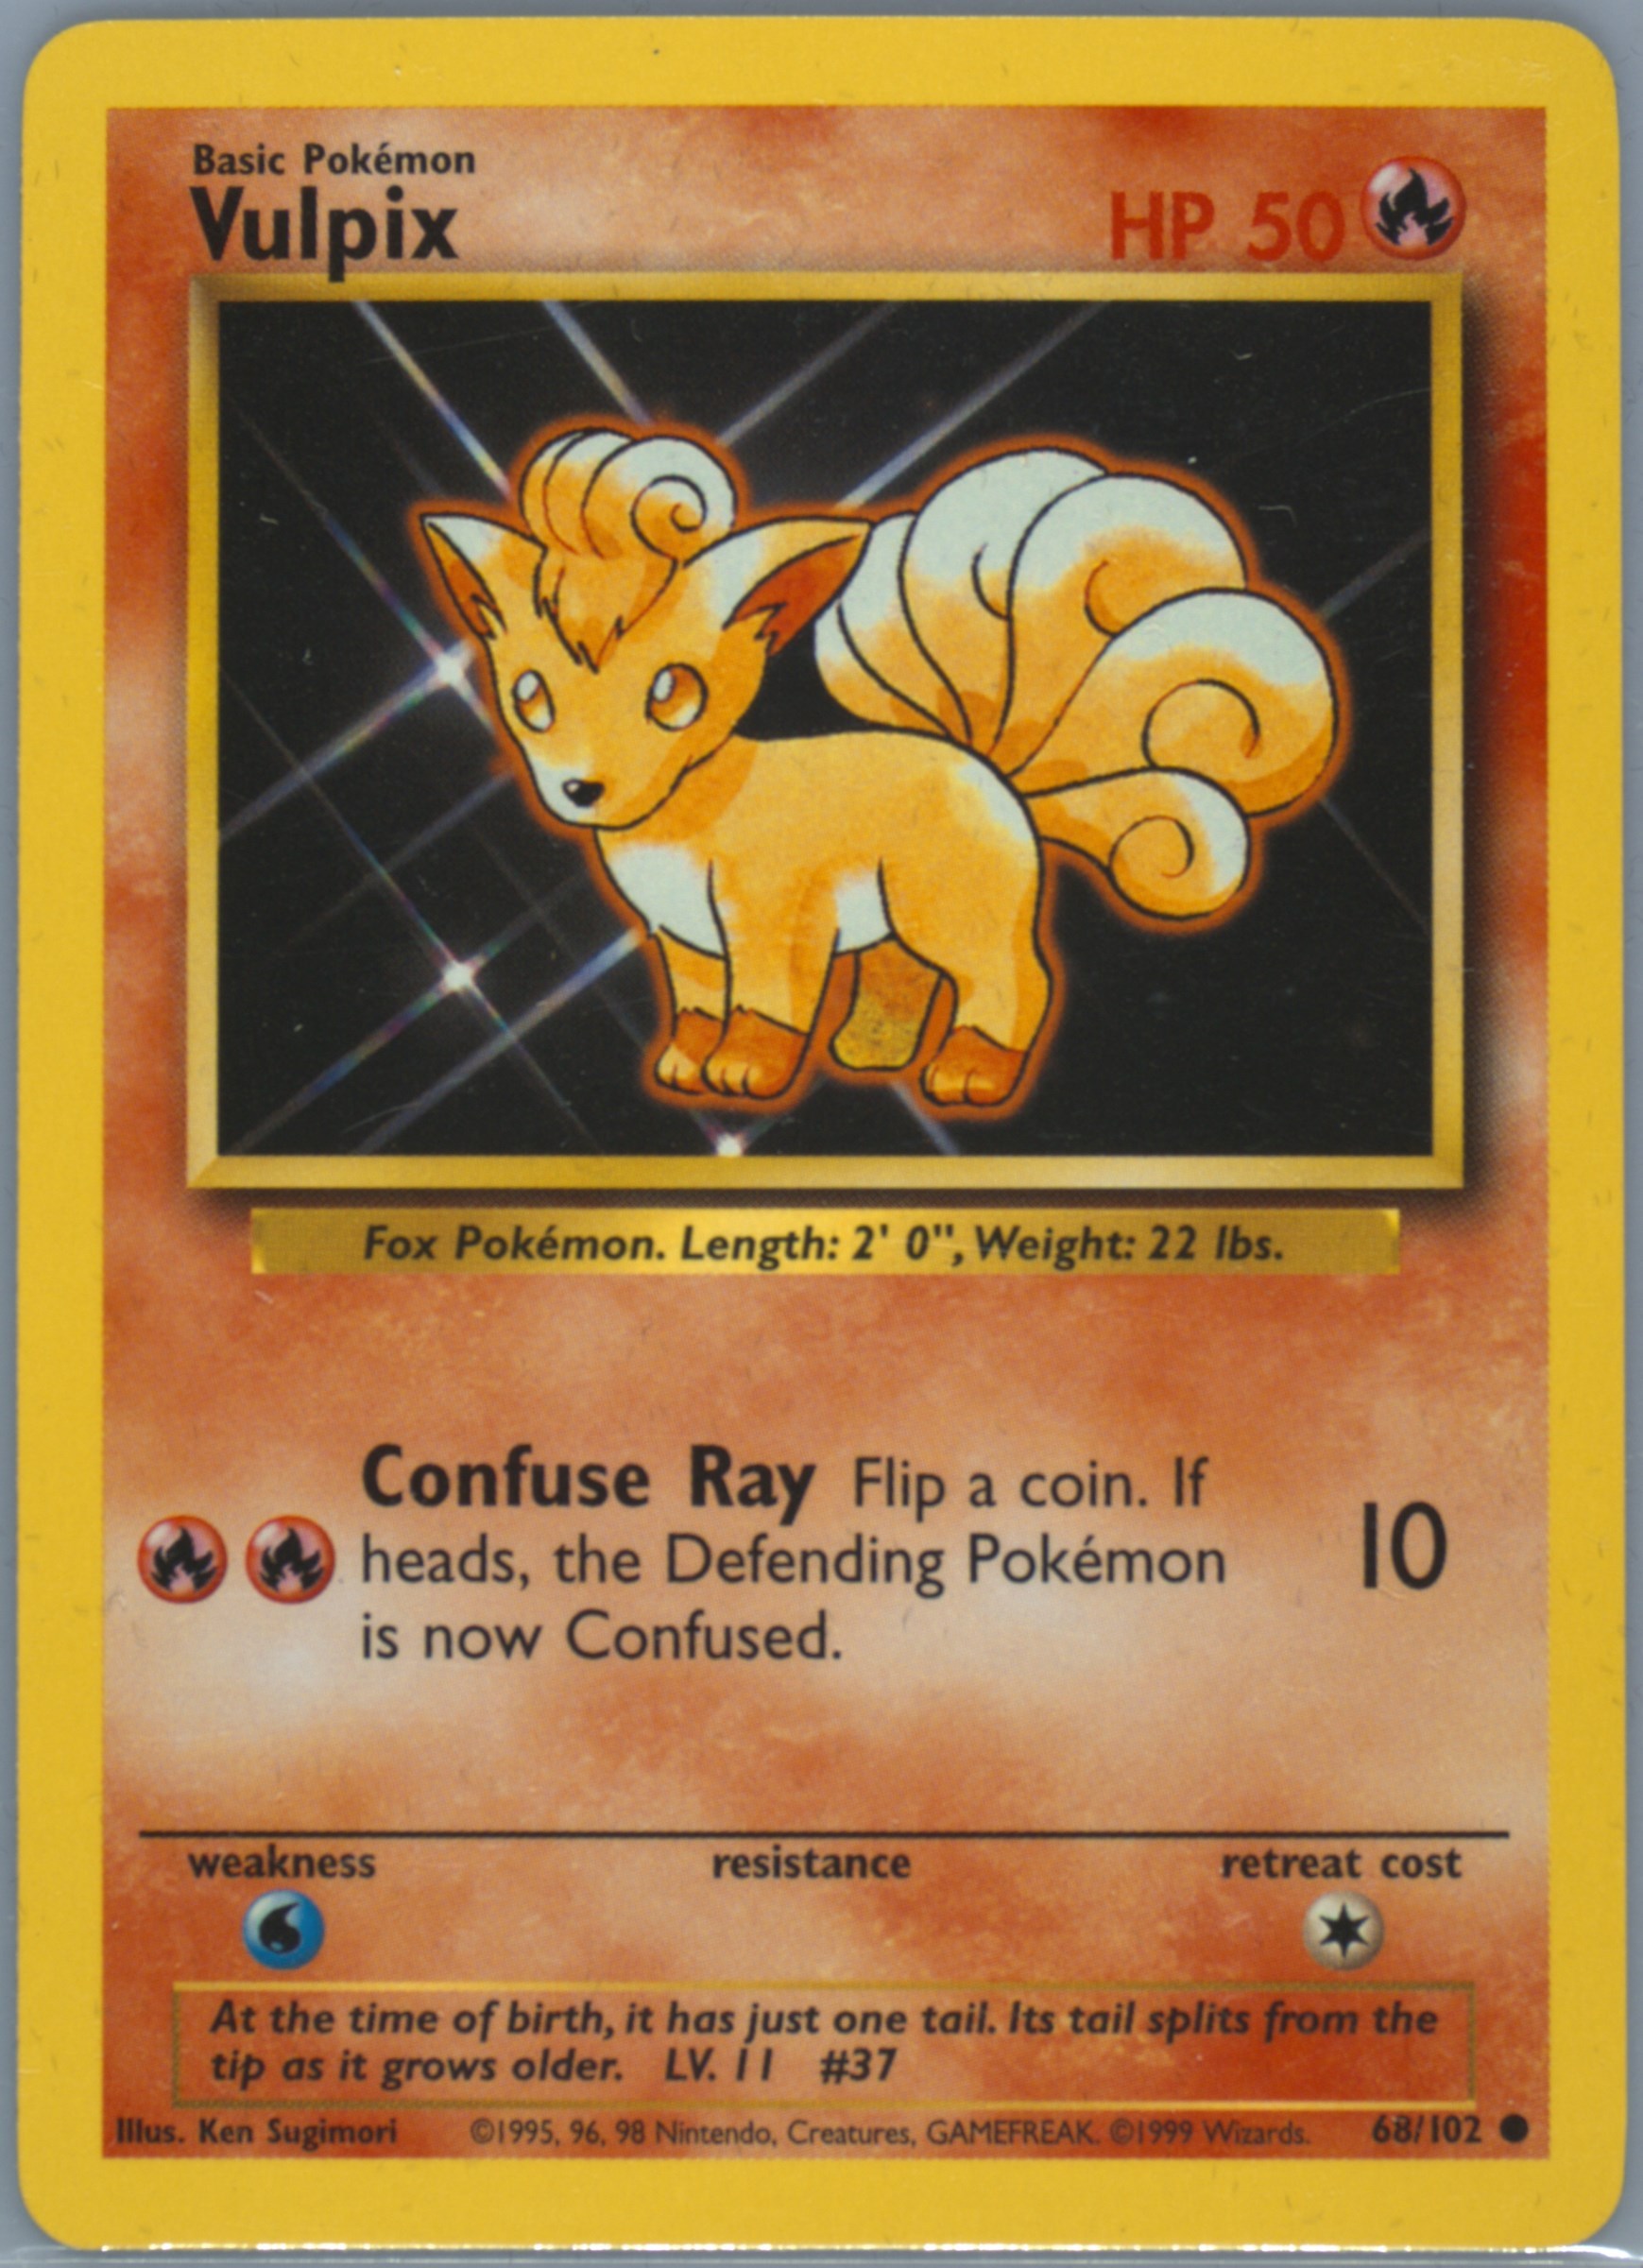
1999 WOTC POKEMON GAME BASE SET UNLIMITED VULPIX #68/102 COMMON PSA 10 GEM MT
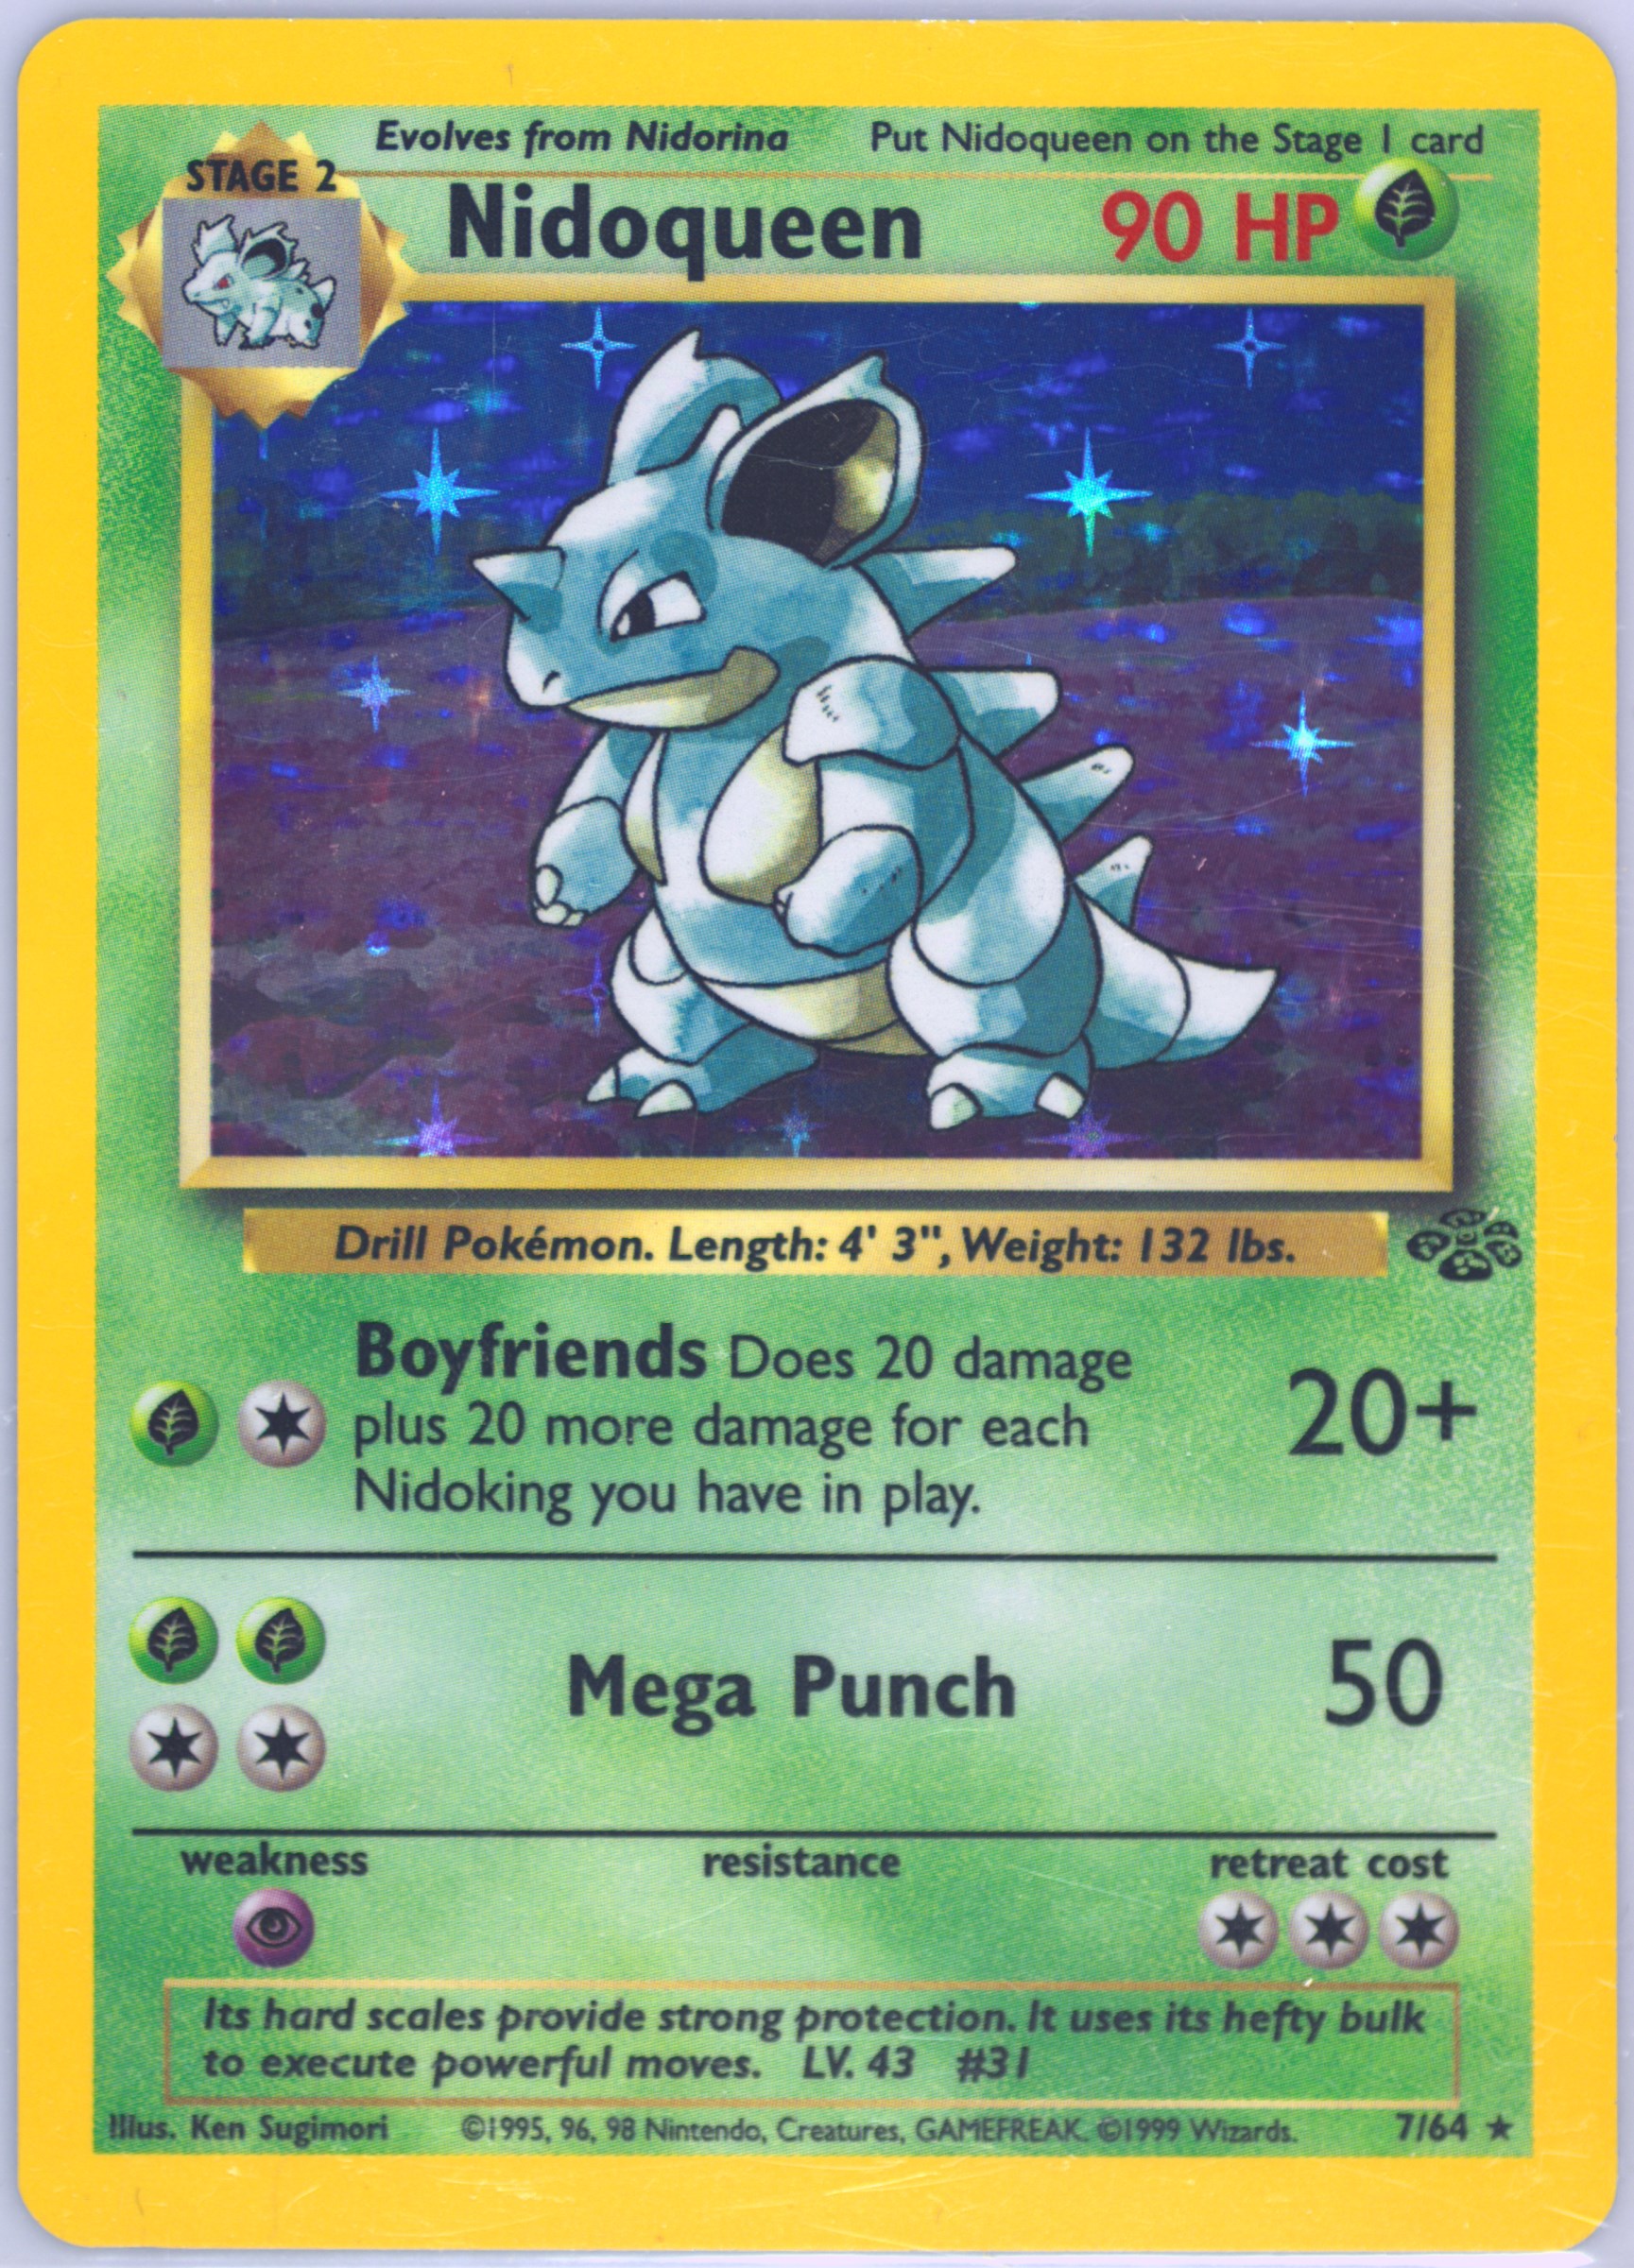
1999 WOTC POKEMON JUNGLE UNLIMITED NIDOQUEEN 7/64 HOLO RARE PSA 9 MINT
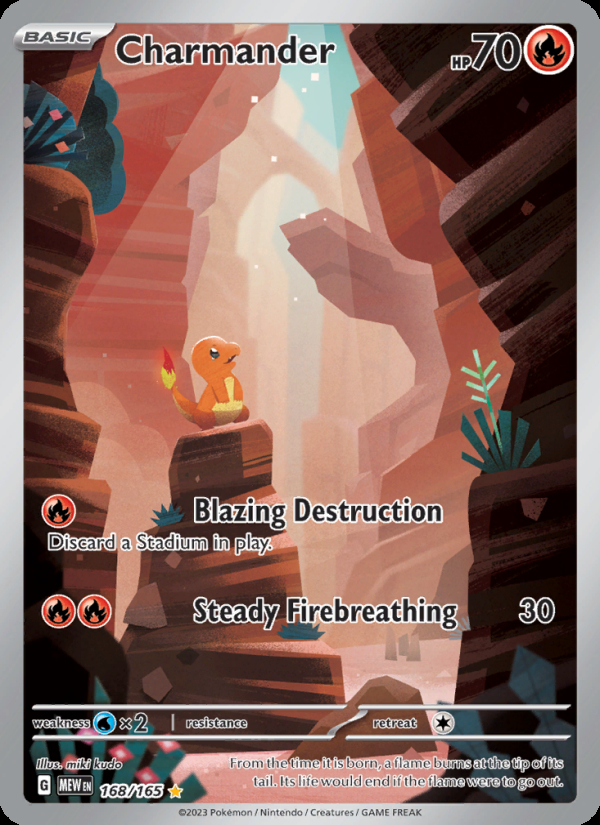
CHARMANDER 2023 POKEMON 151 ILLUSTRATION RARE #168/165 PSA 10 Q0895
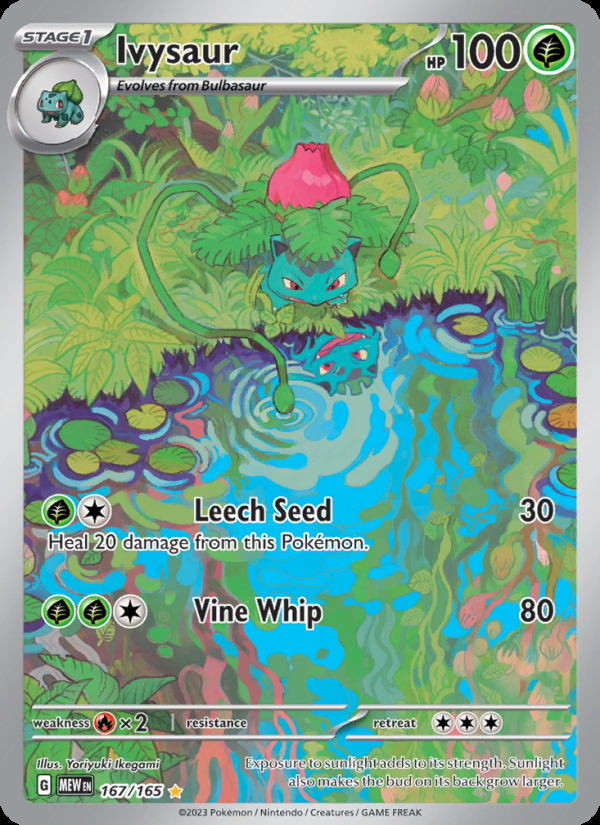
IVYSAUR 2023 POKEMON 151 ILLUSTRATION RARE #167/165 PSA 10 Q3963
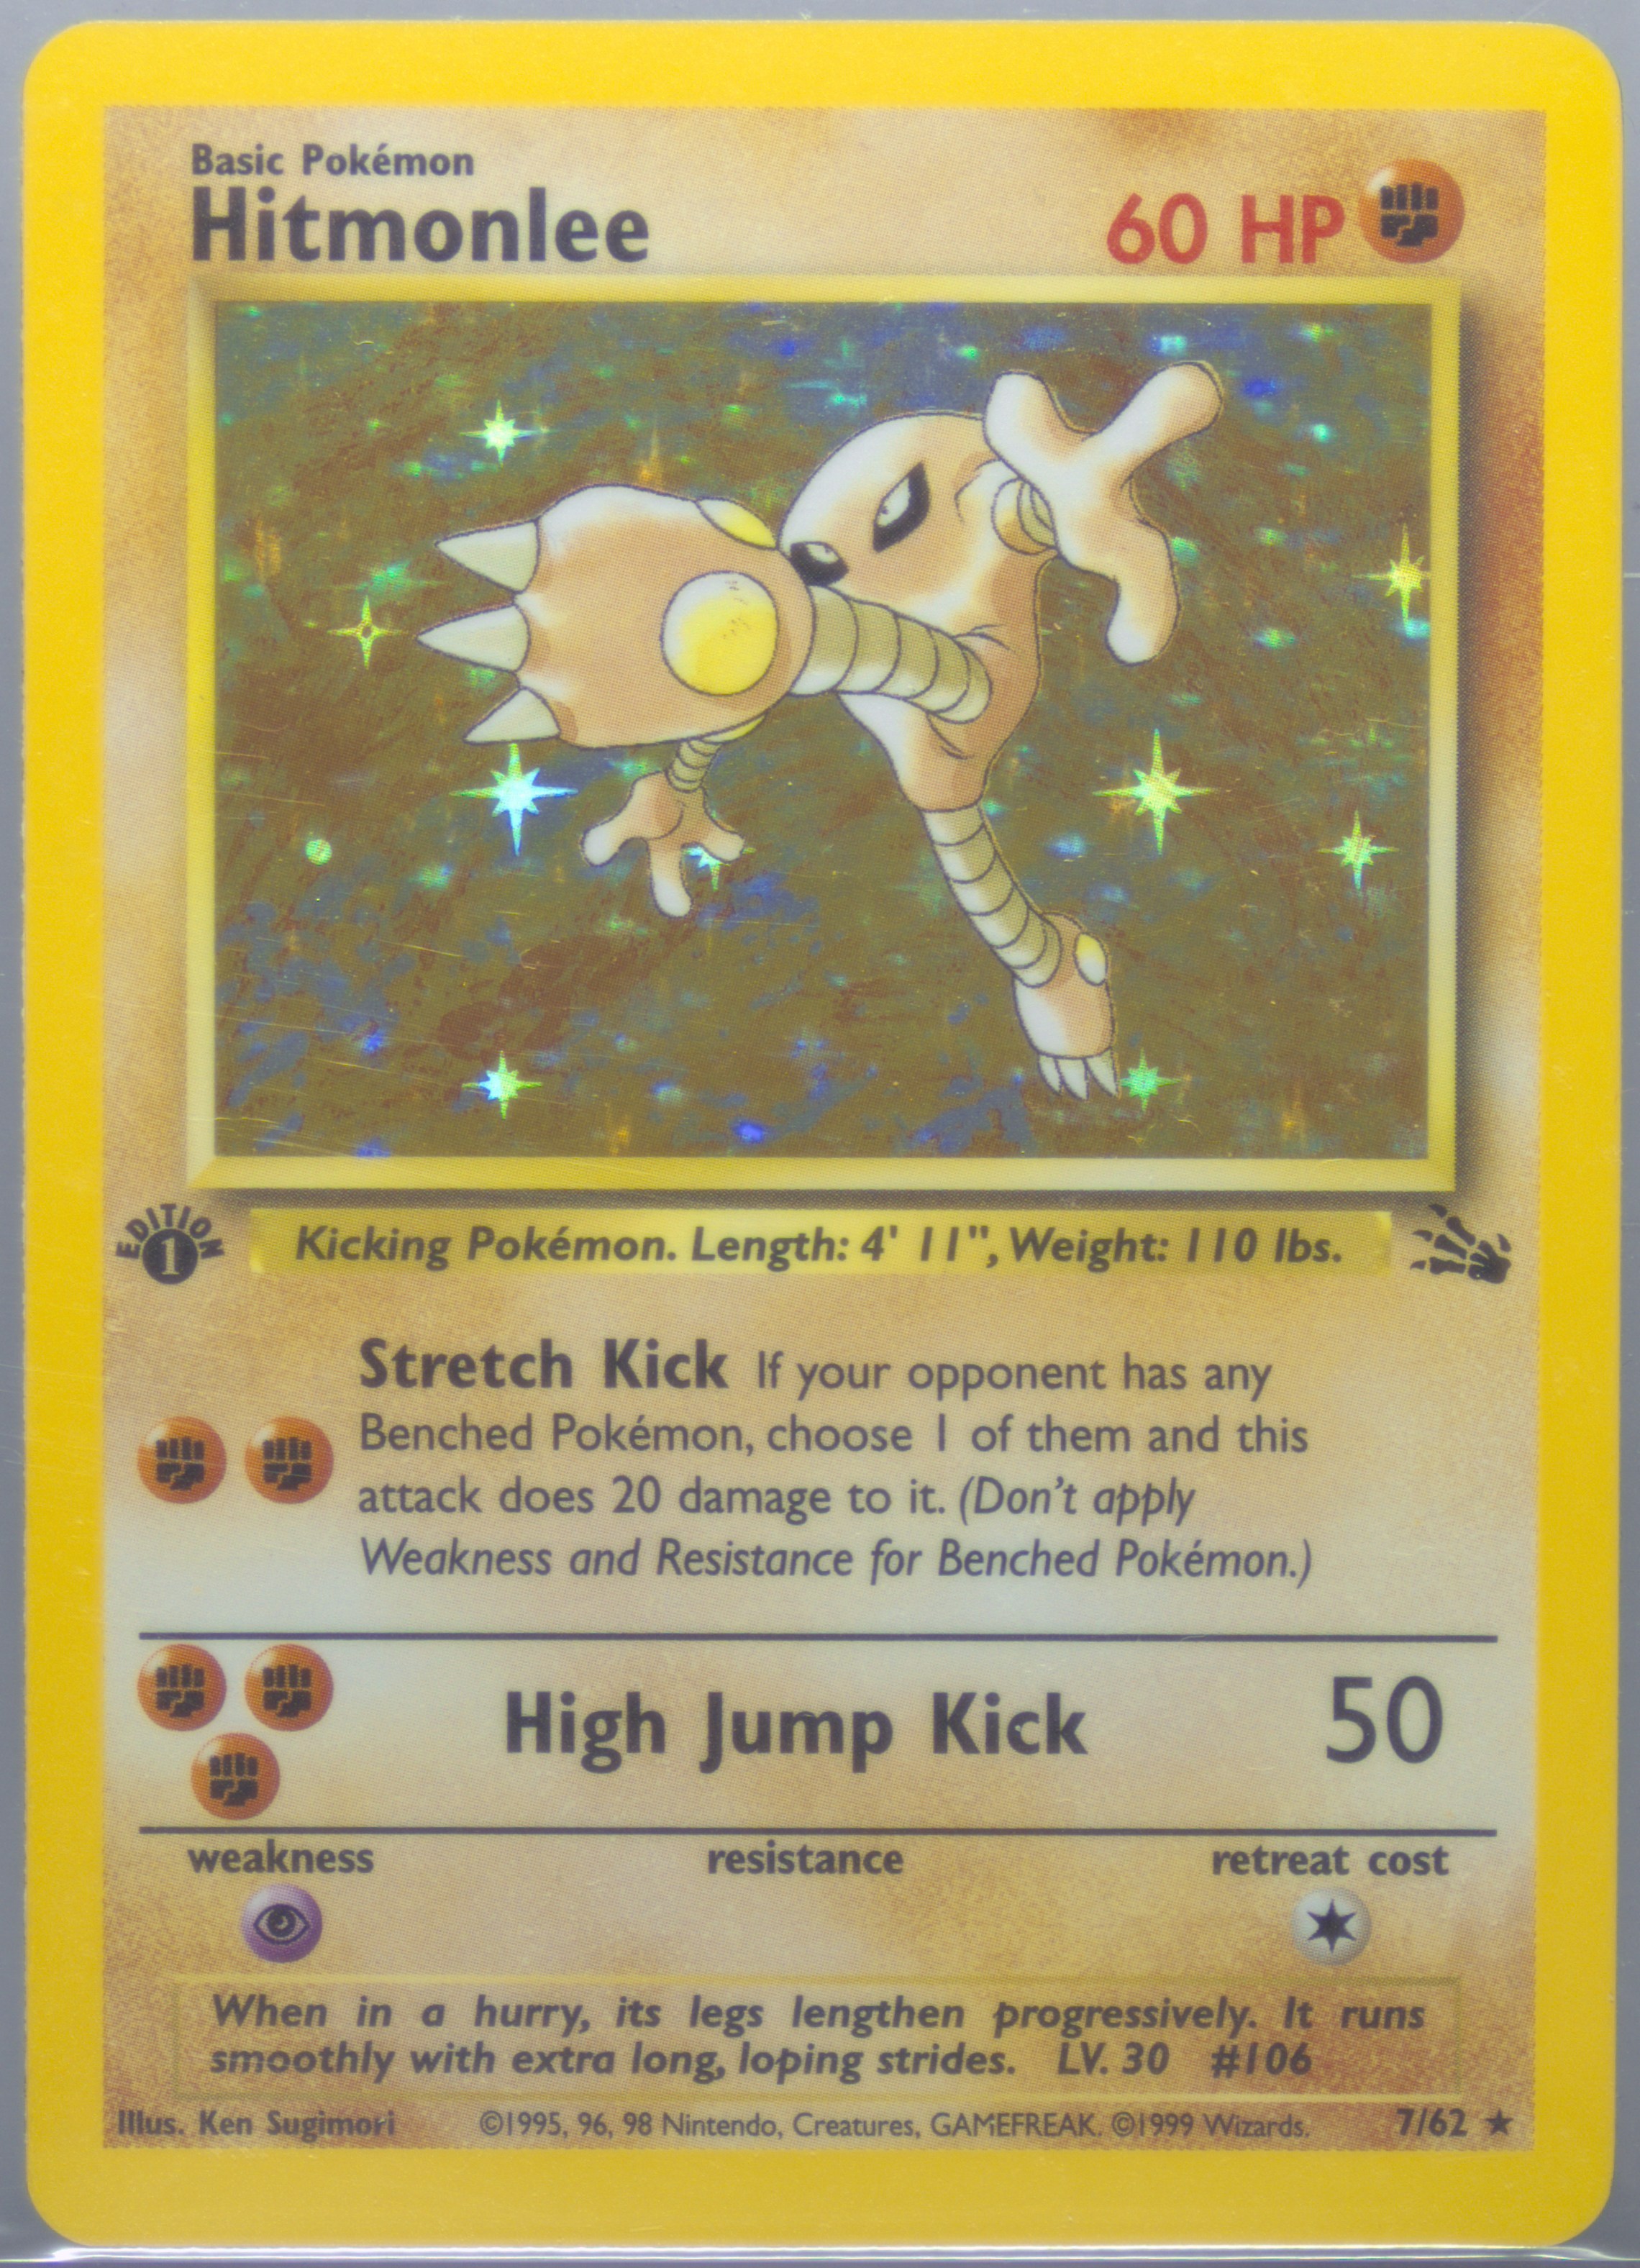
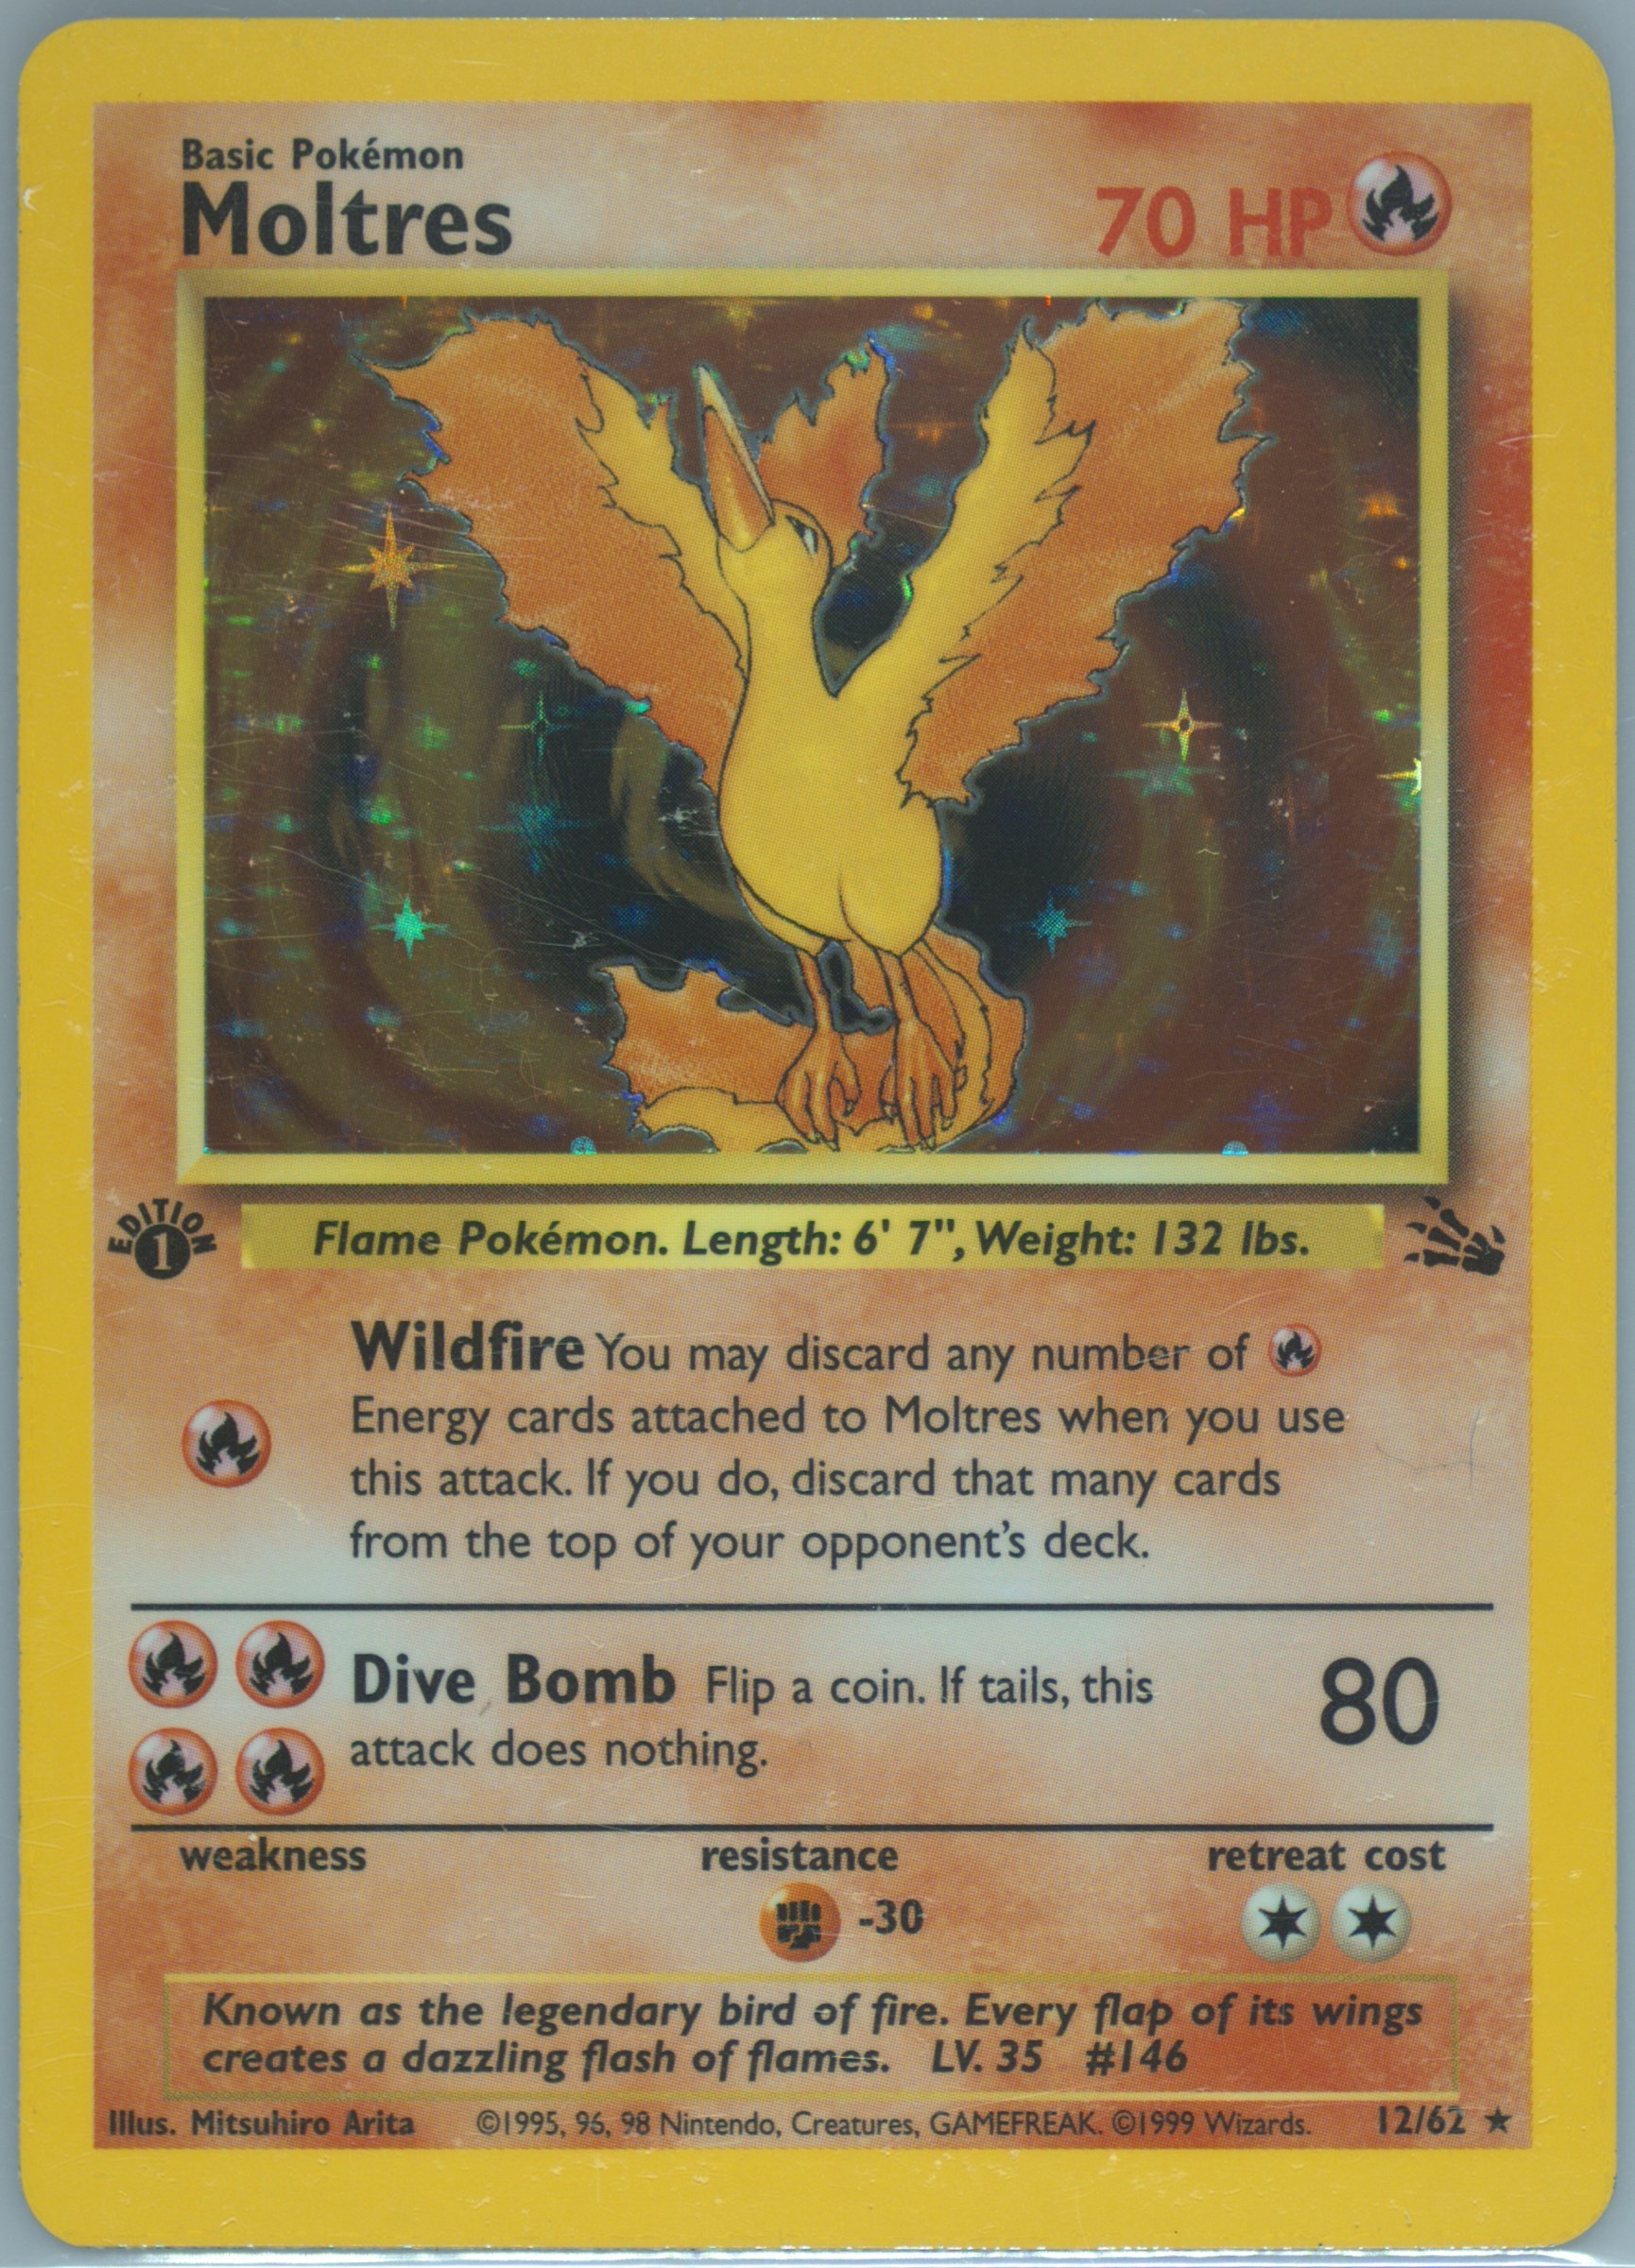
Hitmonlee 1999 Pokémon Fossil 7/62 1st Edition HOLO PSA 9 NS1
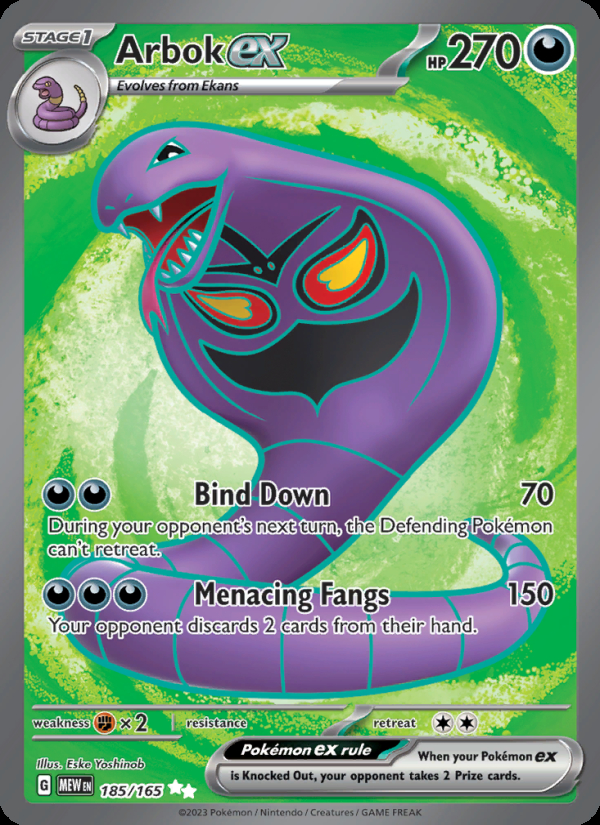
2023 POKEMON TCG MEW EN 151 ARBOK EX #185/165 FULL ART ULTRA RARE PSA 10 GEM MT
CHARMANDER 2023 POKEMON 151 ILLUSTRATION RARE #168/165 PSA 10 Q0895
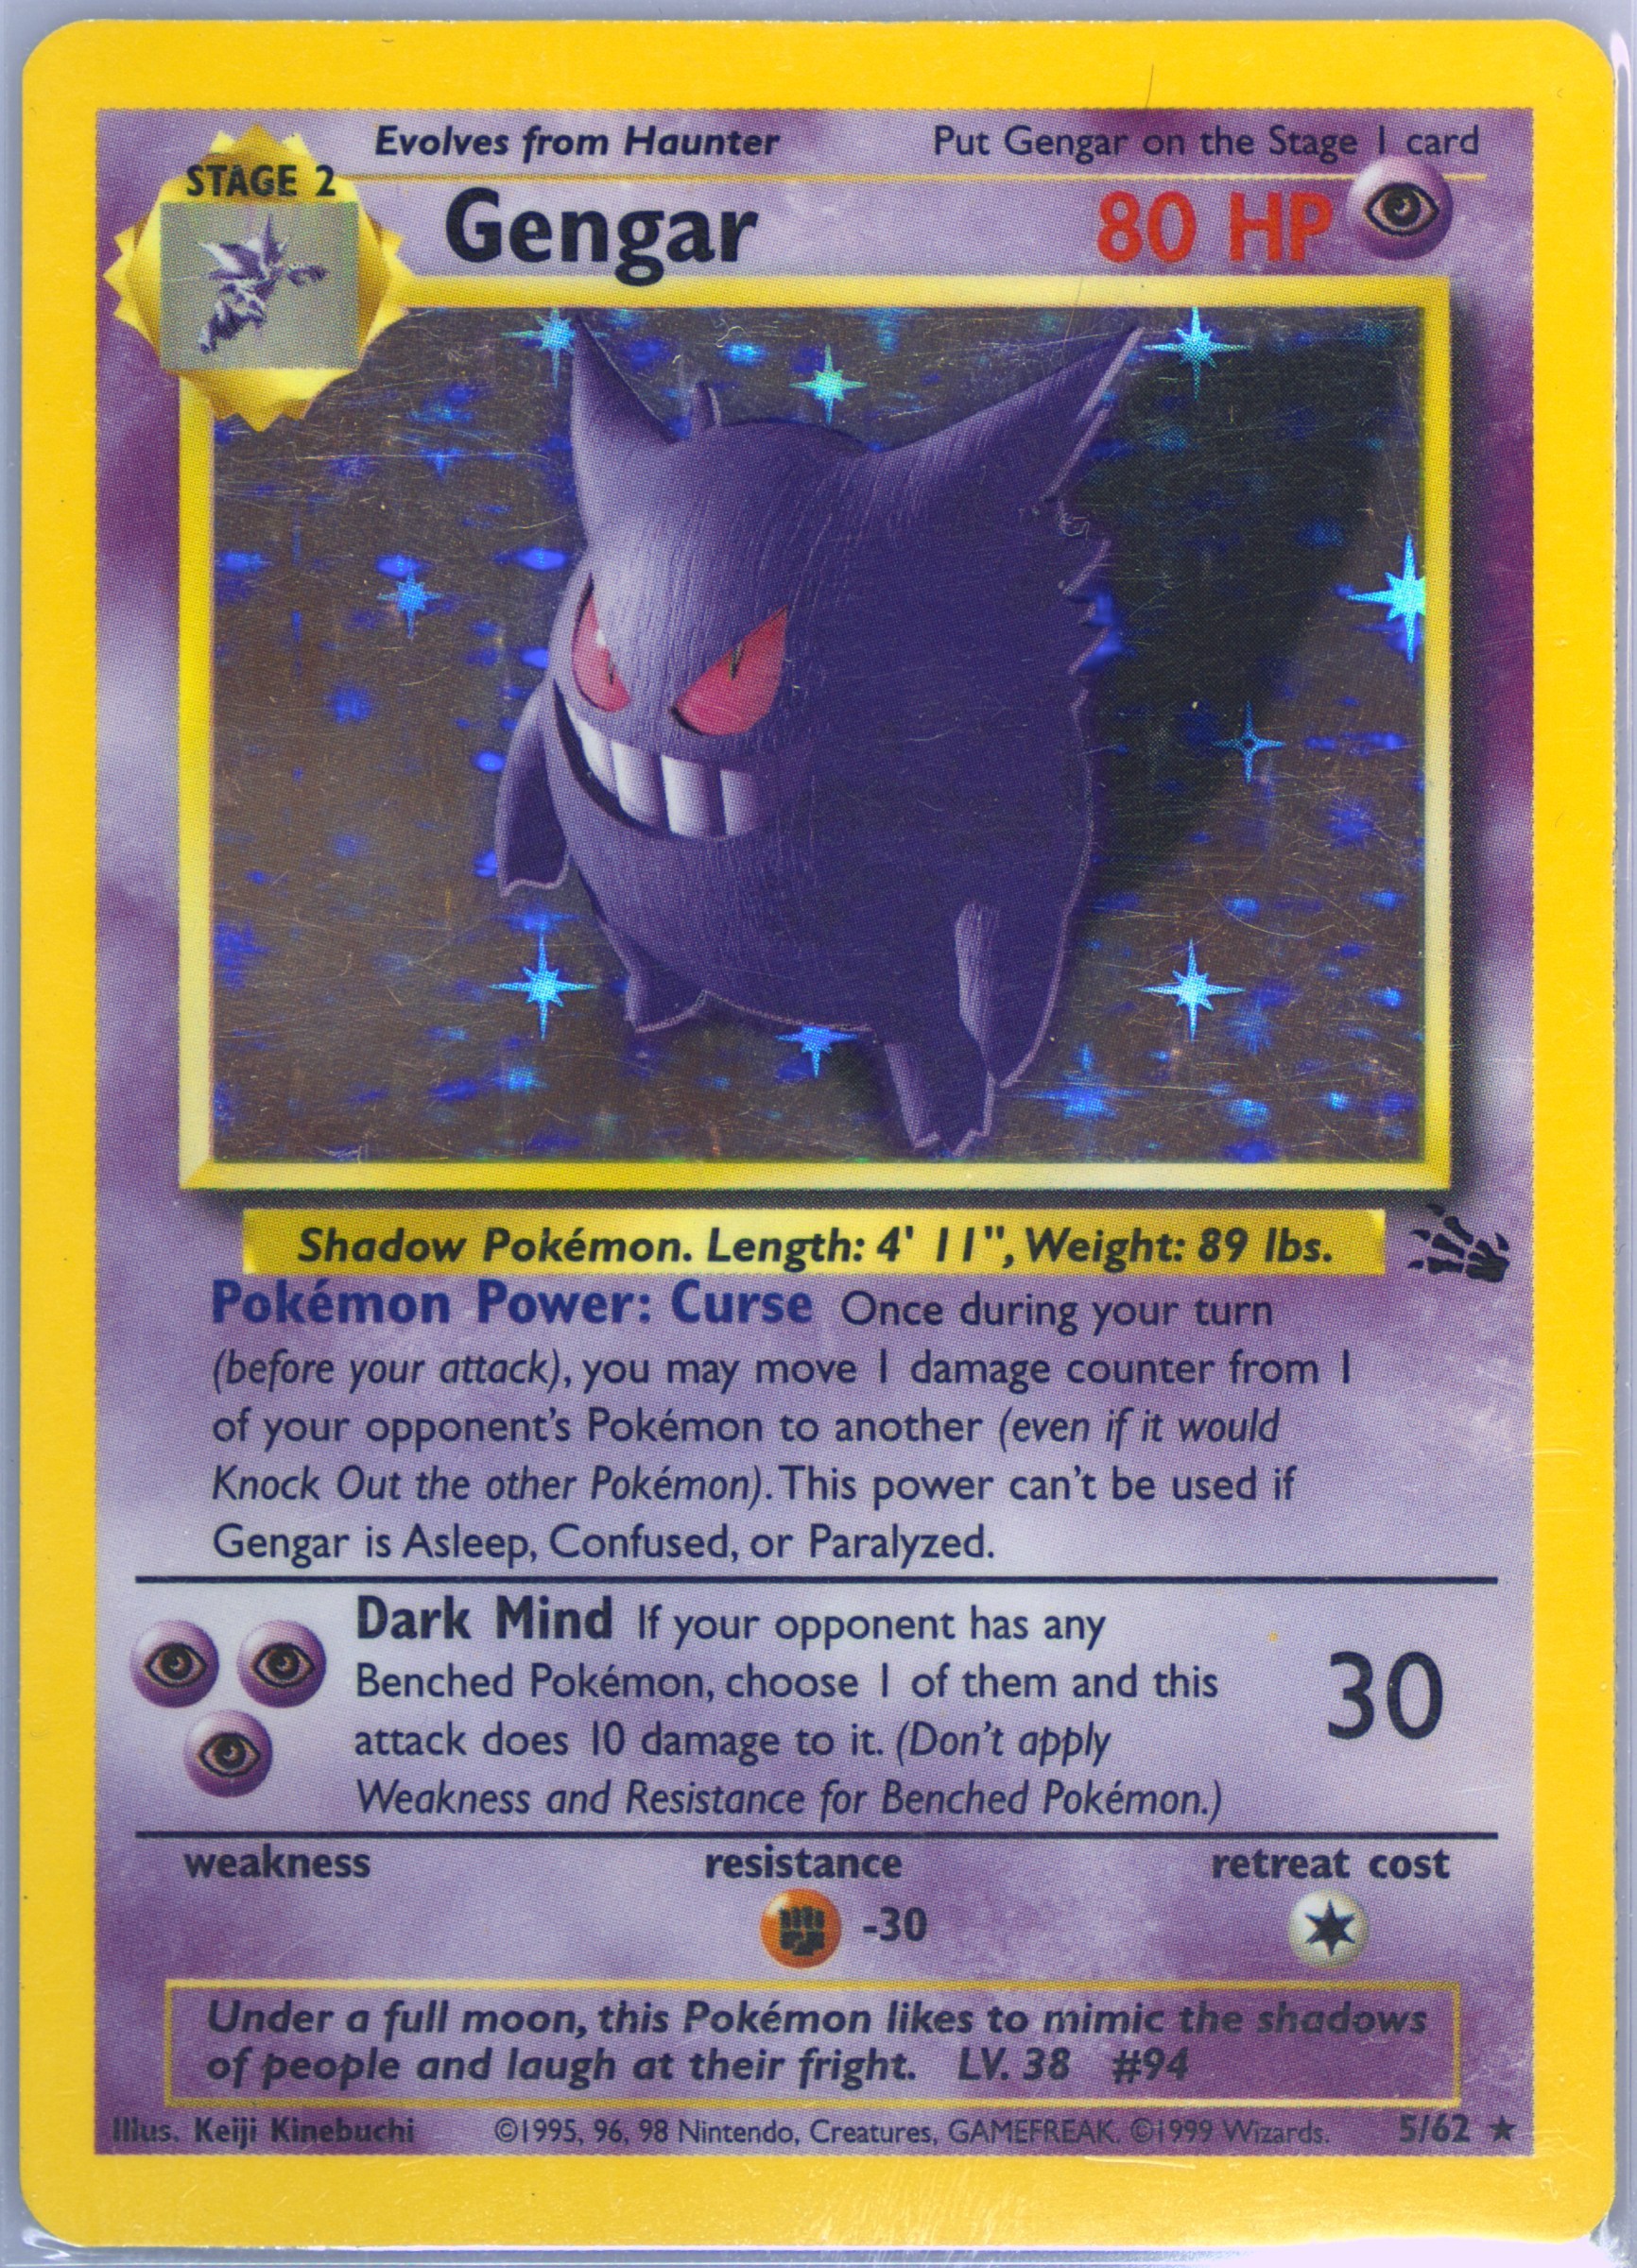
1999 WOTC POKEMON TCG FOSSIL UNLIMITED GENGAR 5/62 HOLO RARE PSA 8 NM-MT
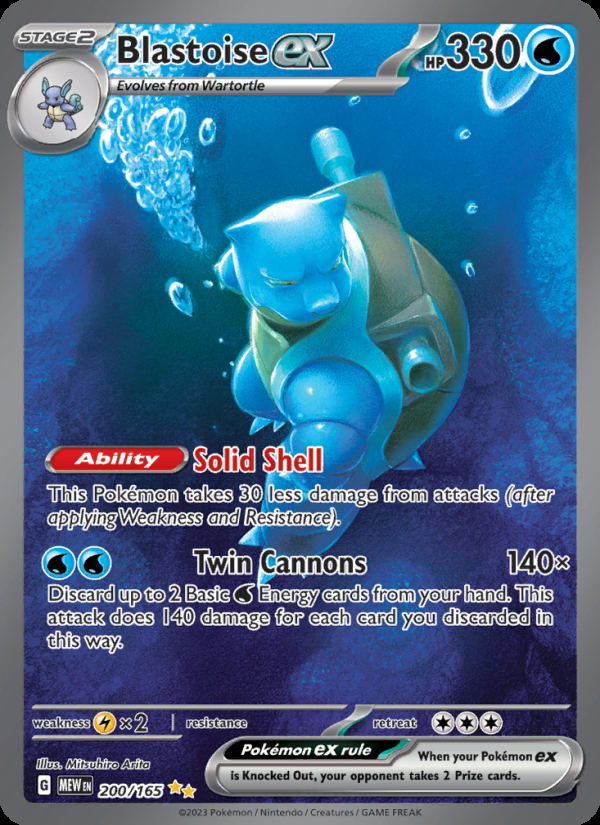
Pokemon 2023 SV151 Mew en Blastoise EX #200/165 PSA 9
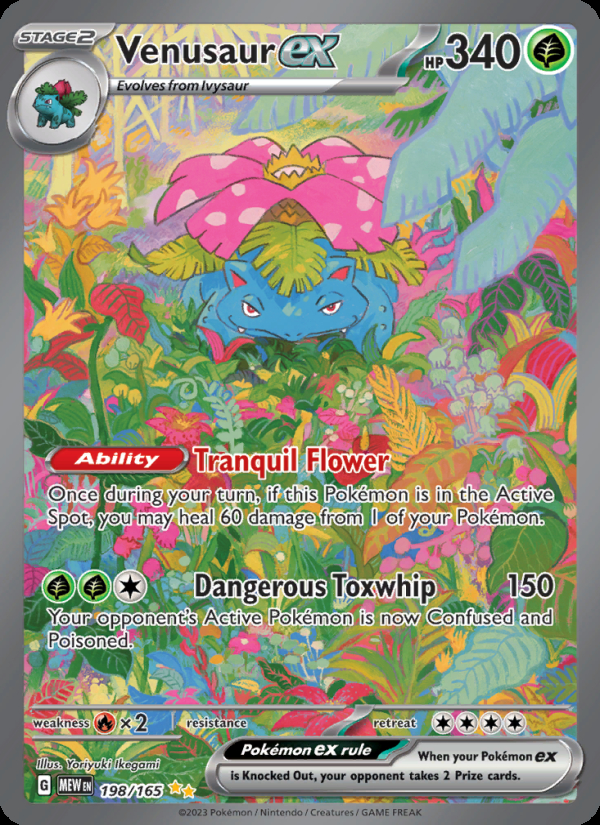
2023 POKEMON TCG MEW EN 151 VENUSAUR EX #198/165 SIR HOLO PSA 10 GEM MT
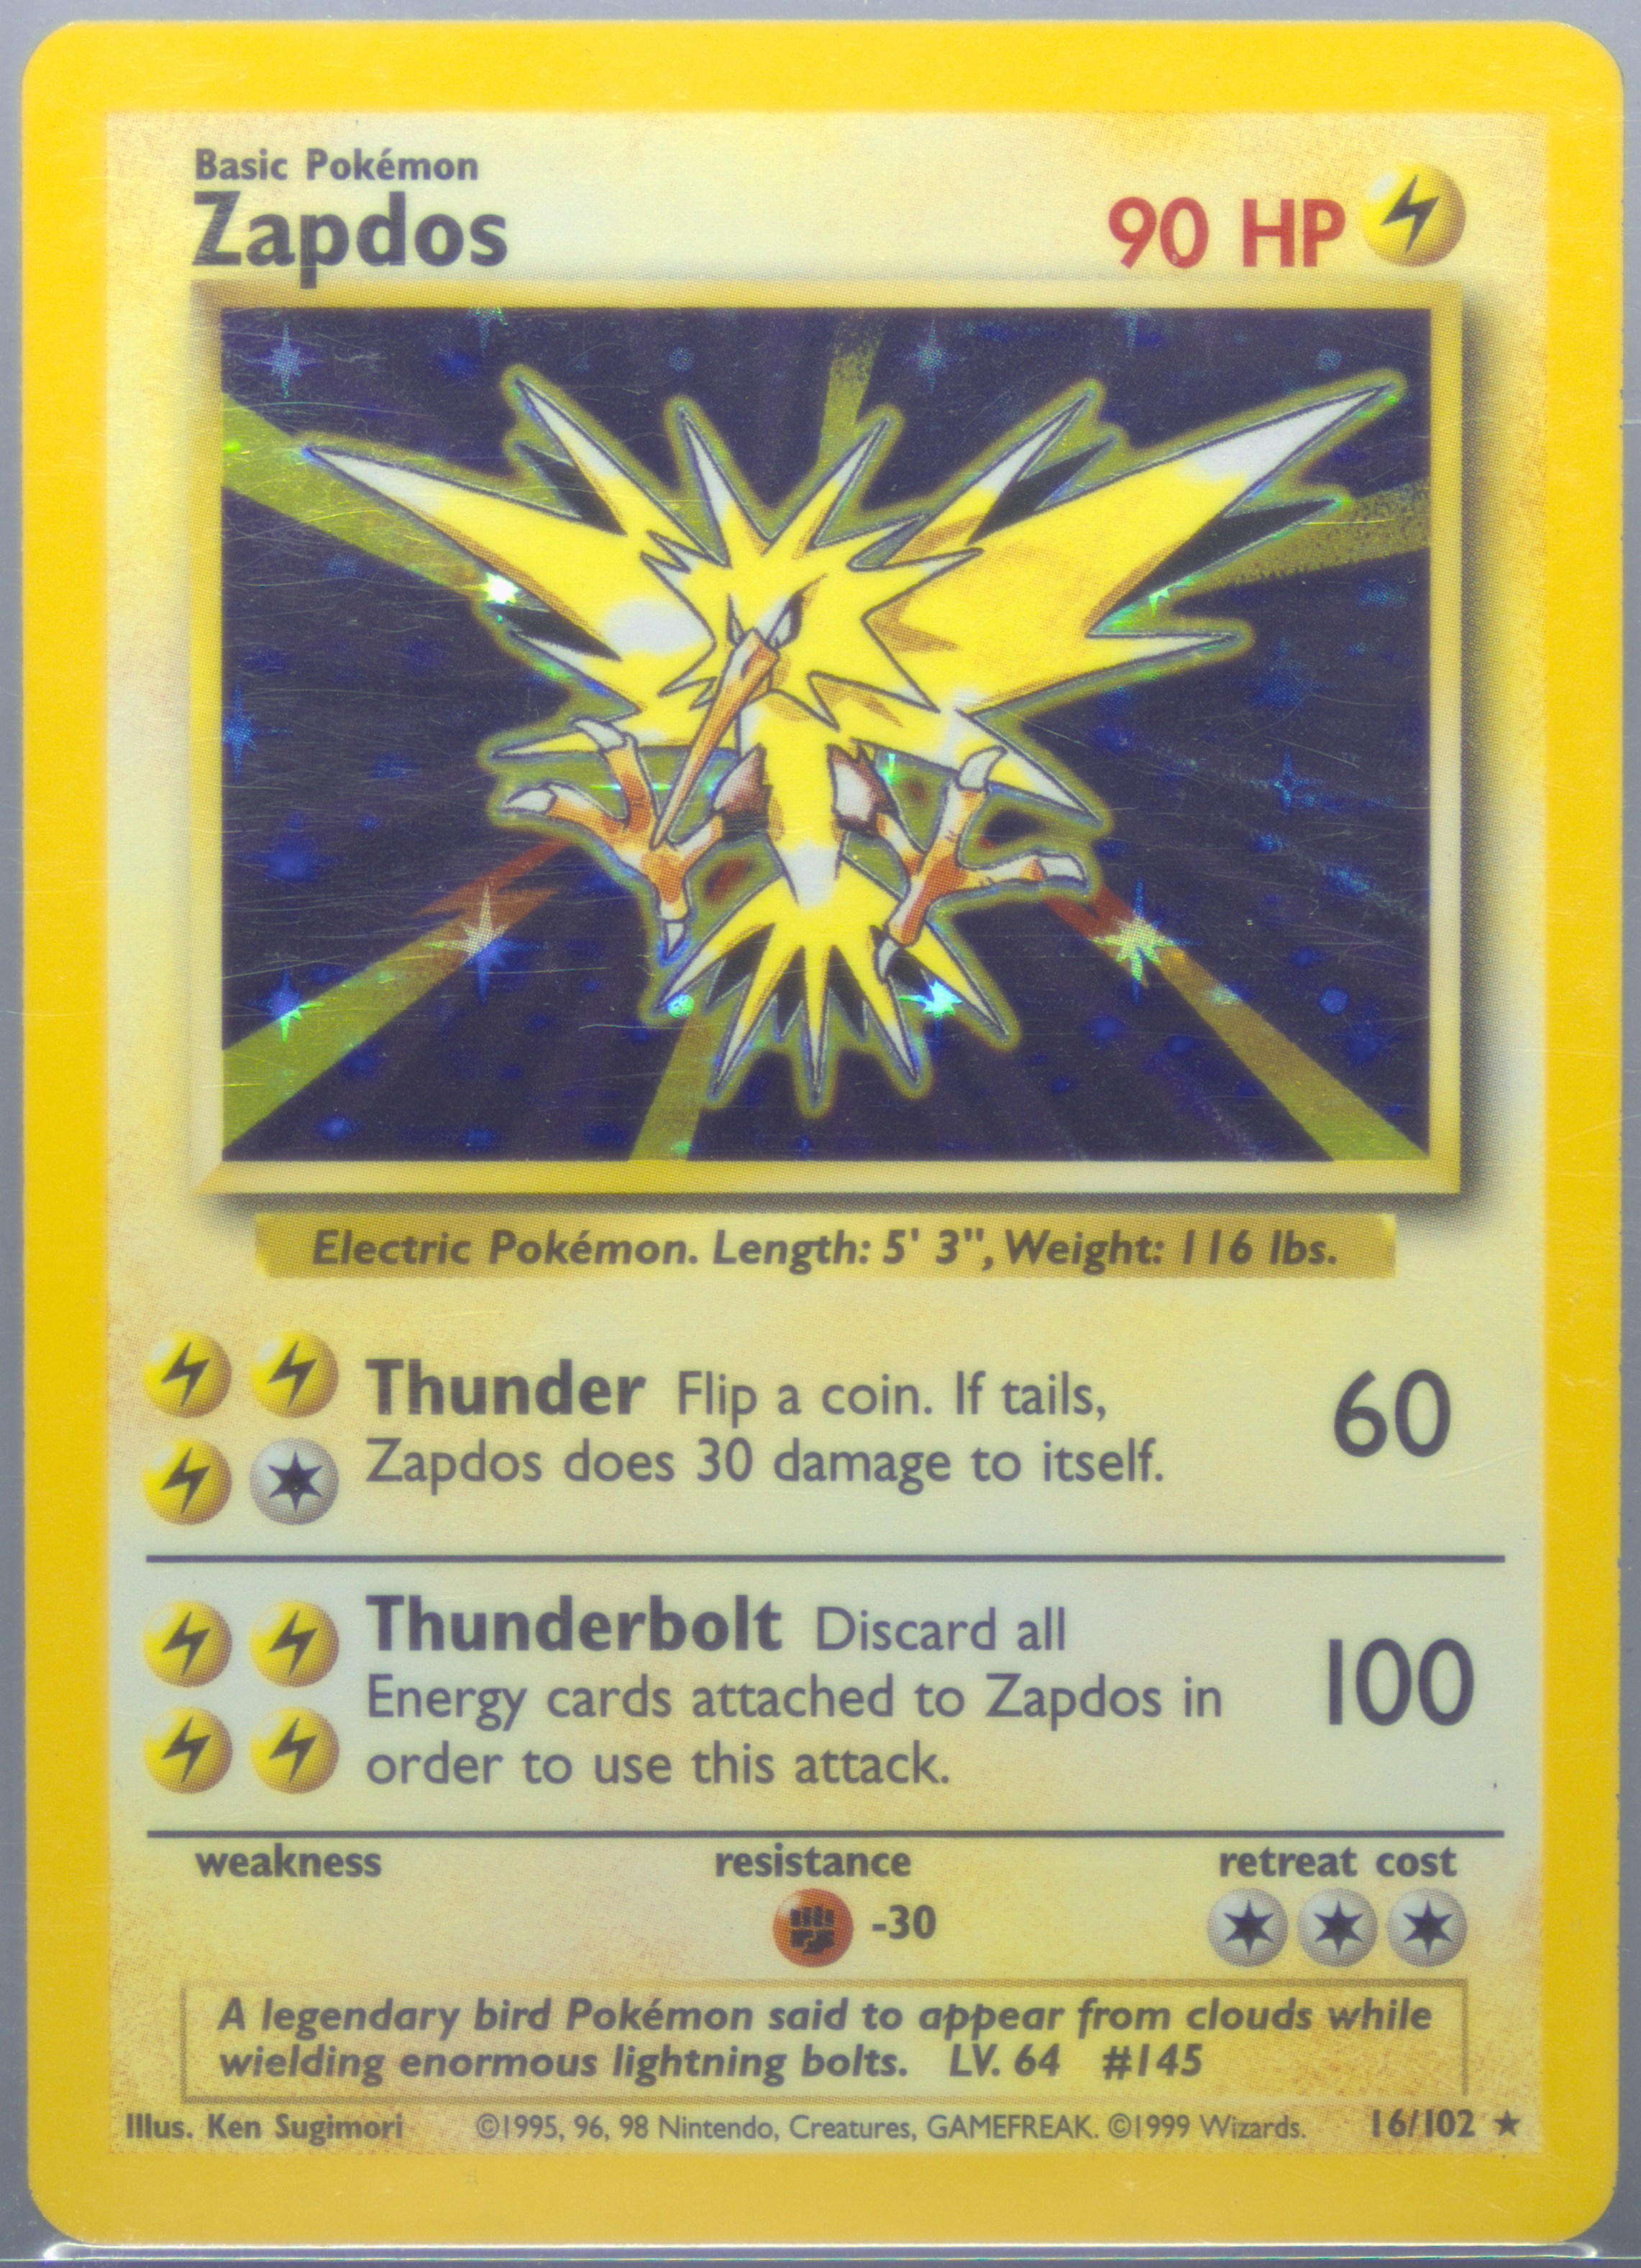
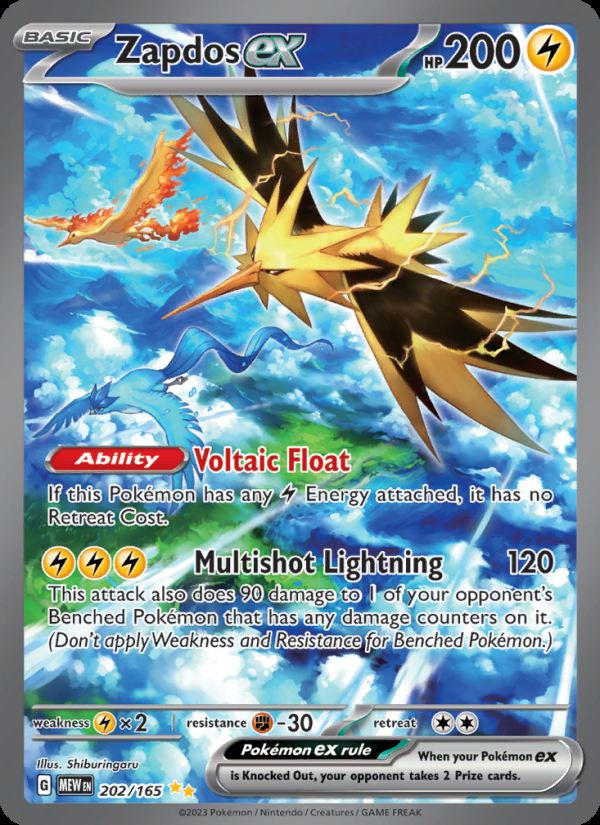
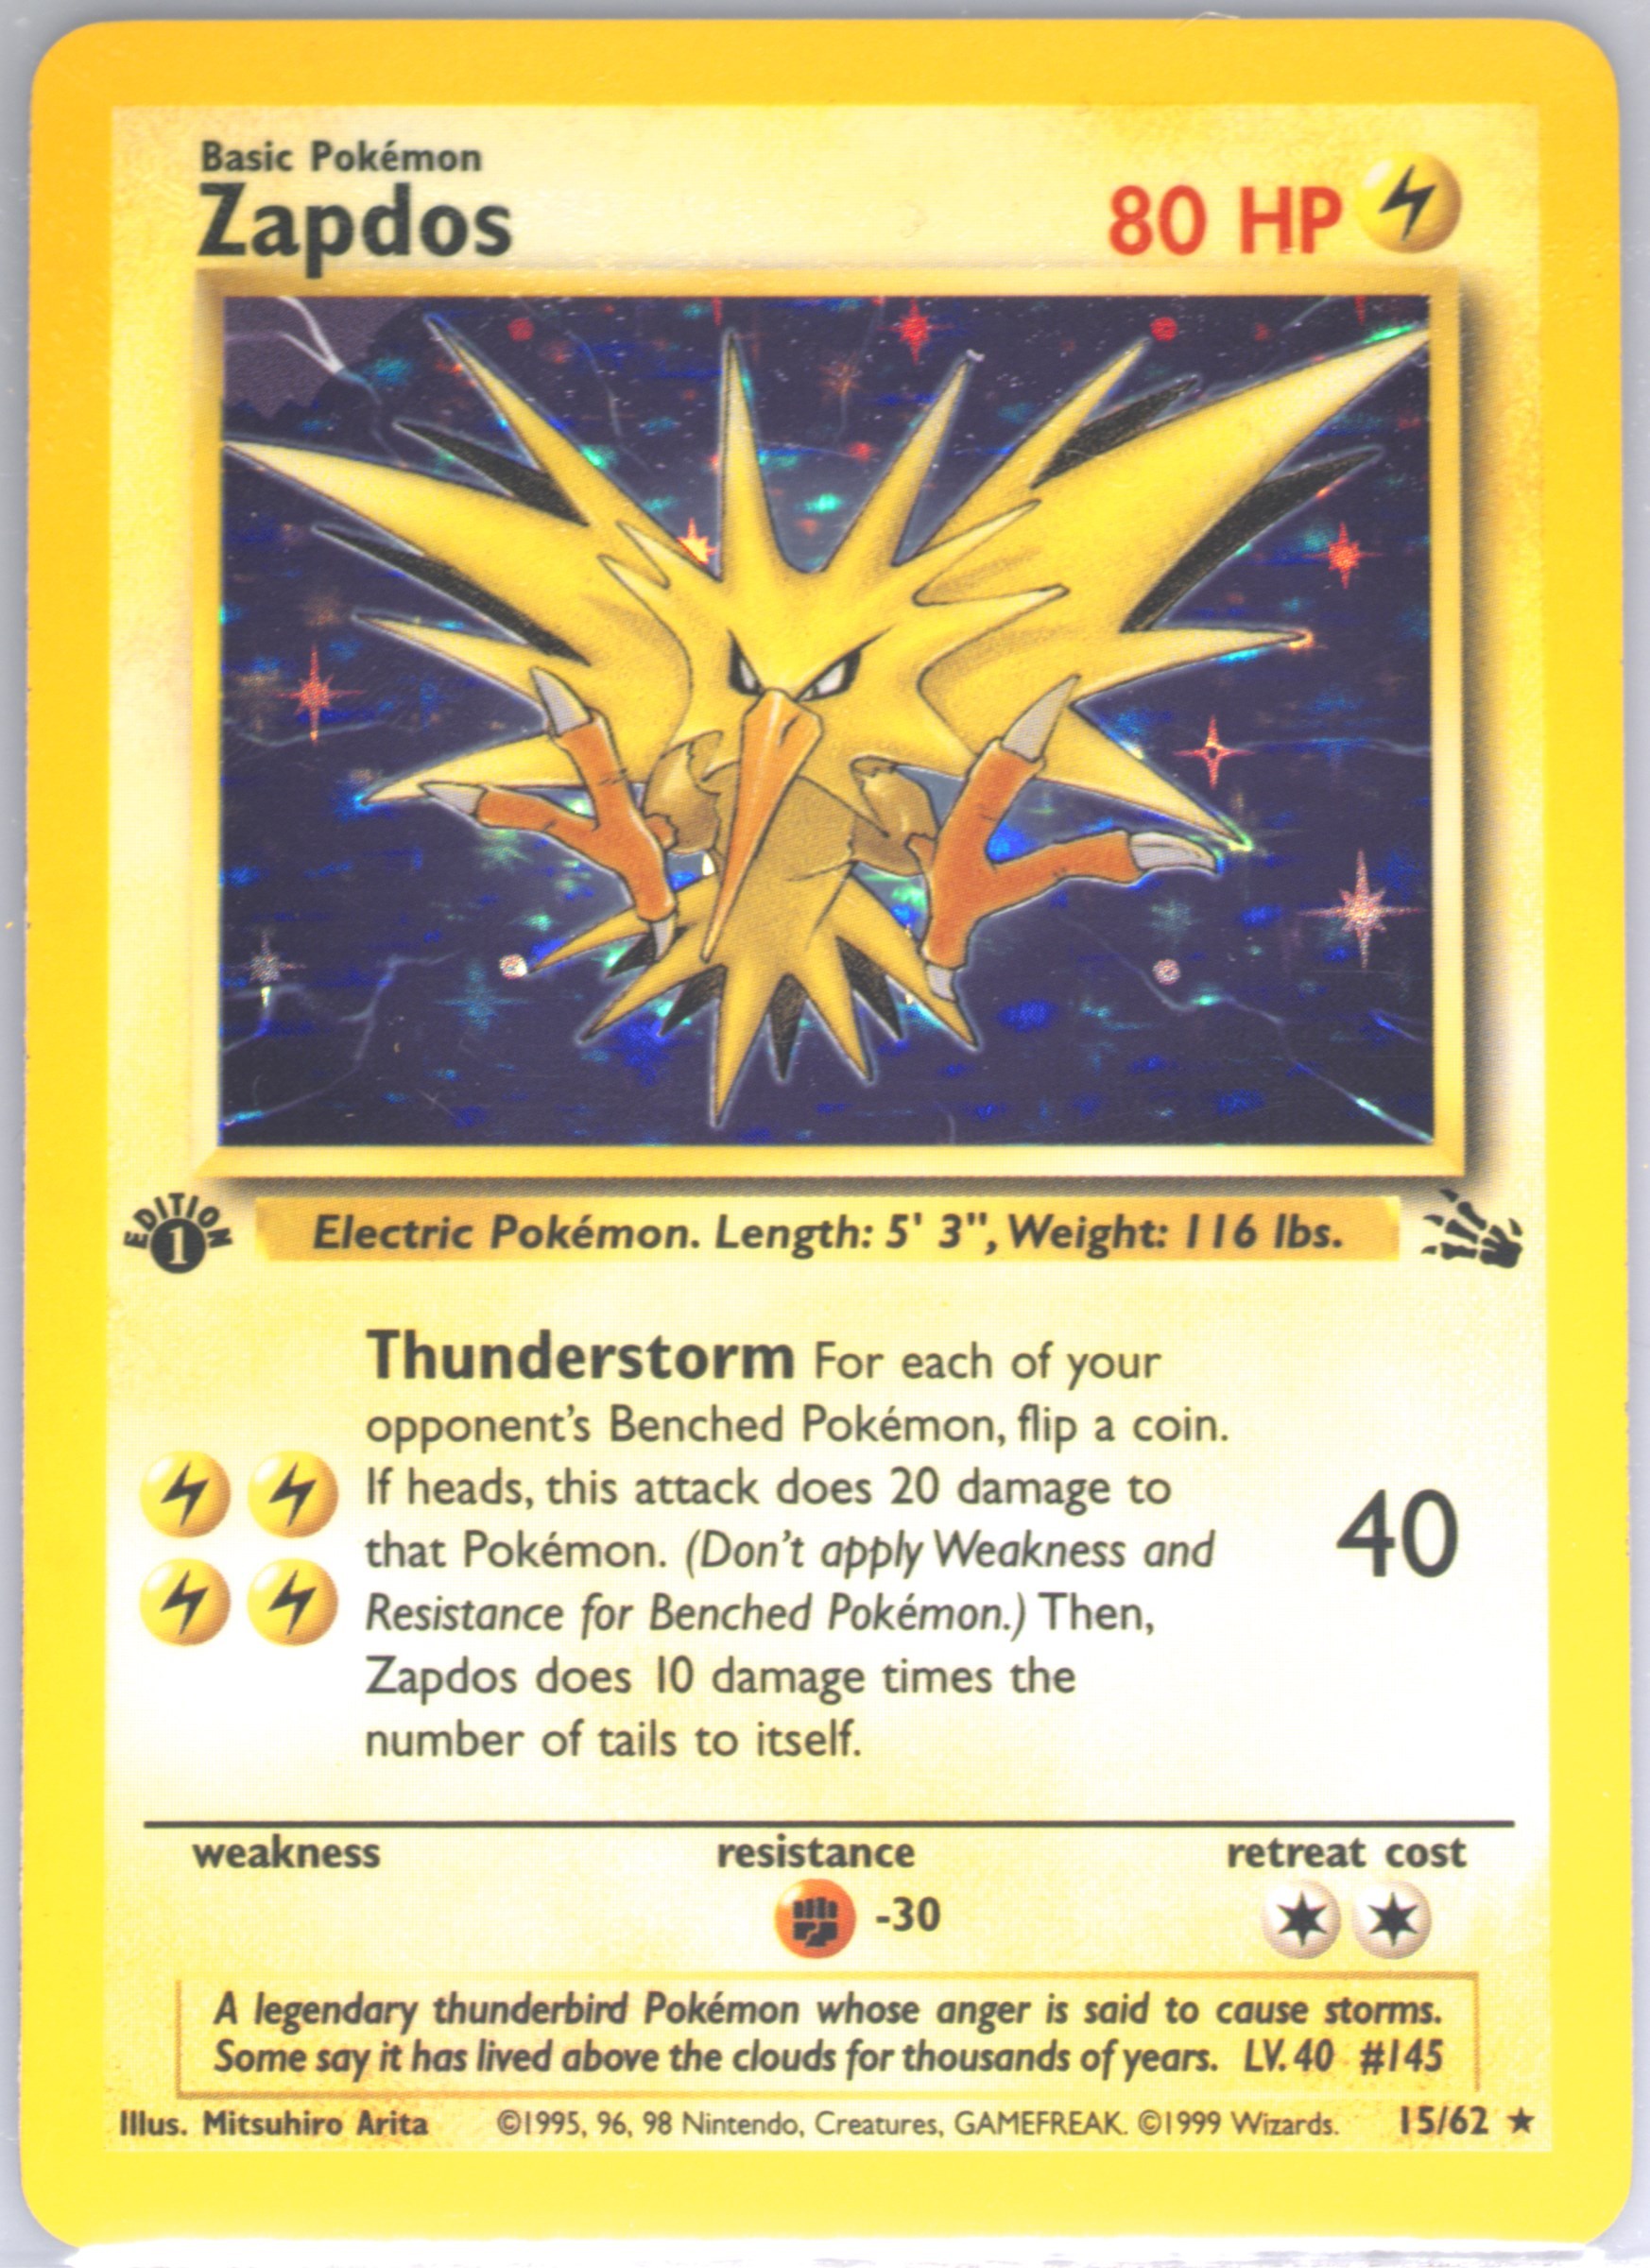
1999 WOTC POKEMON BASE SET UNLIMITED ZAPDOS 16/102 RARE HOLO FOIL PSA 9 MINT
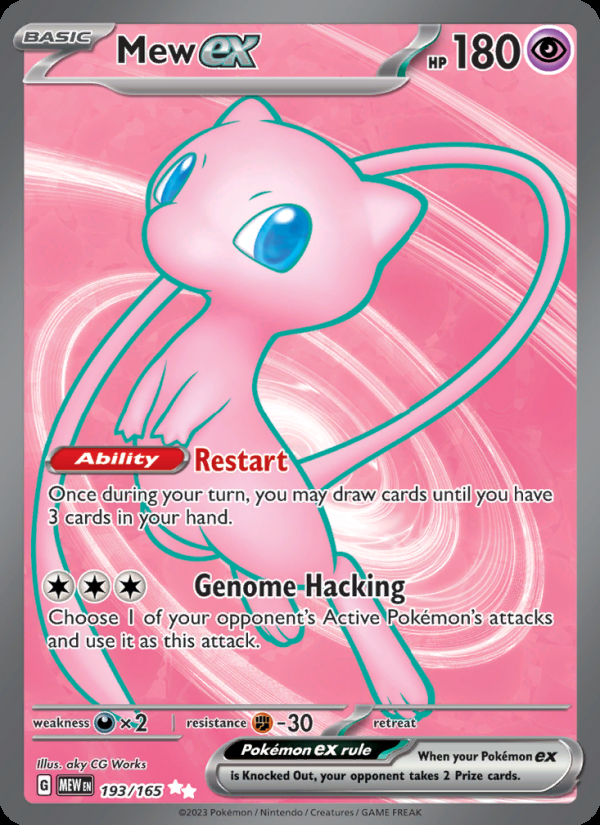
2023 POKEMON TCG MEW EN 151 MEW EX #193/165 FULL ART ULTRA RARE PSA 10 GEM MT
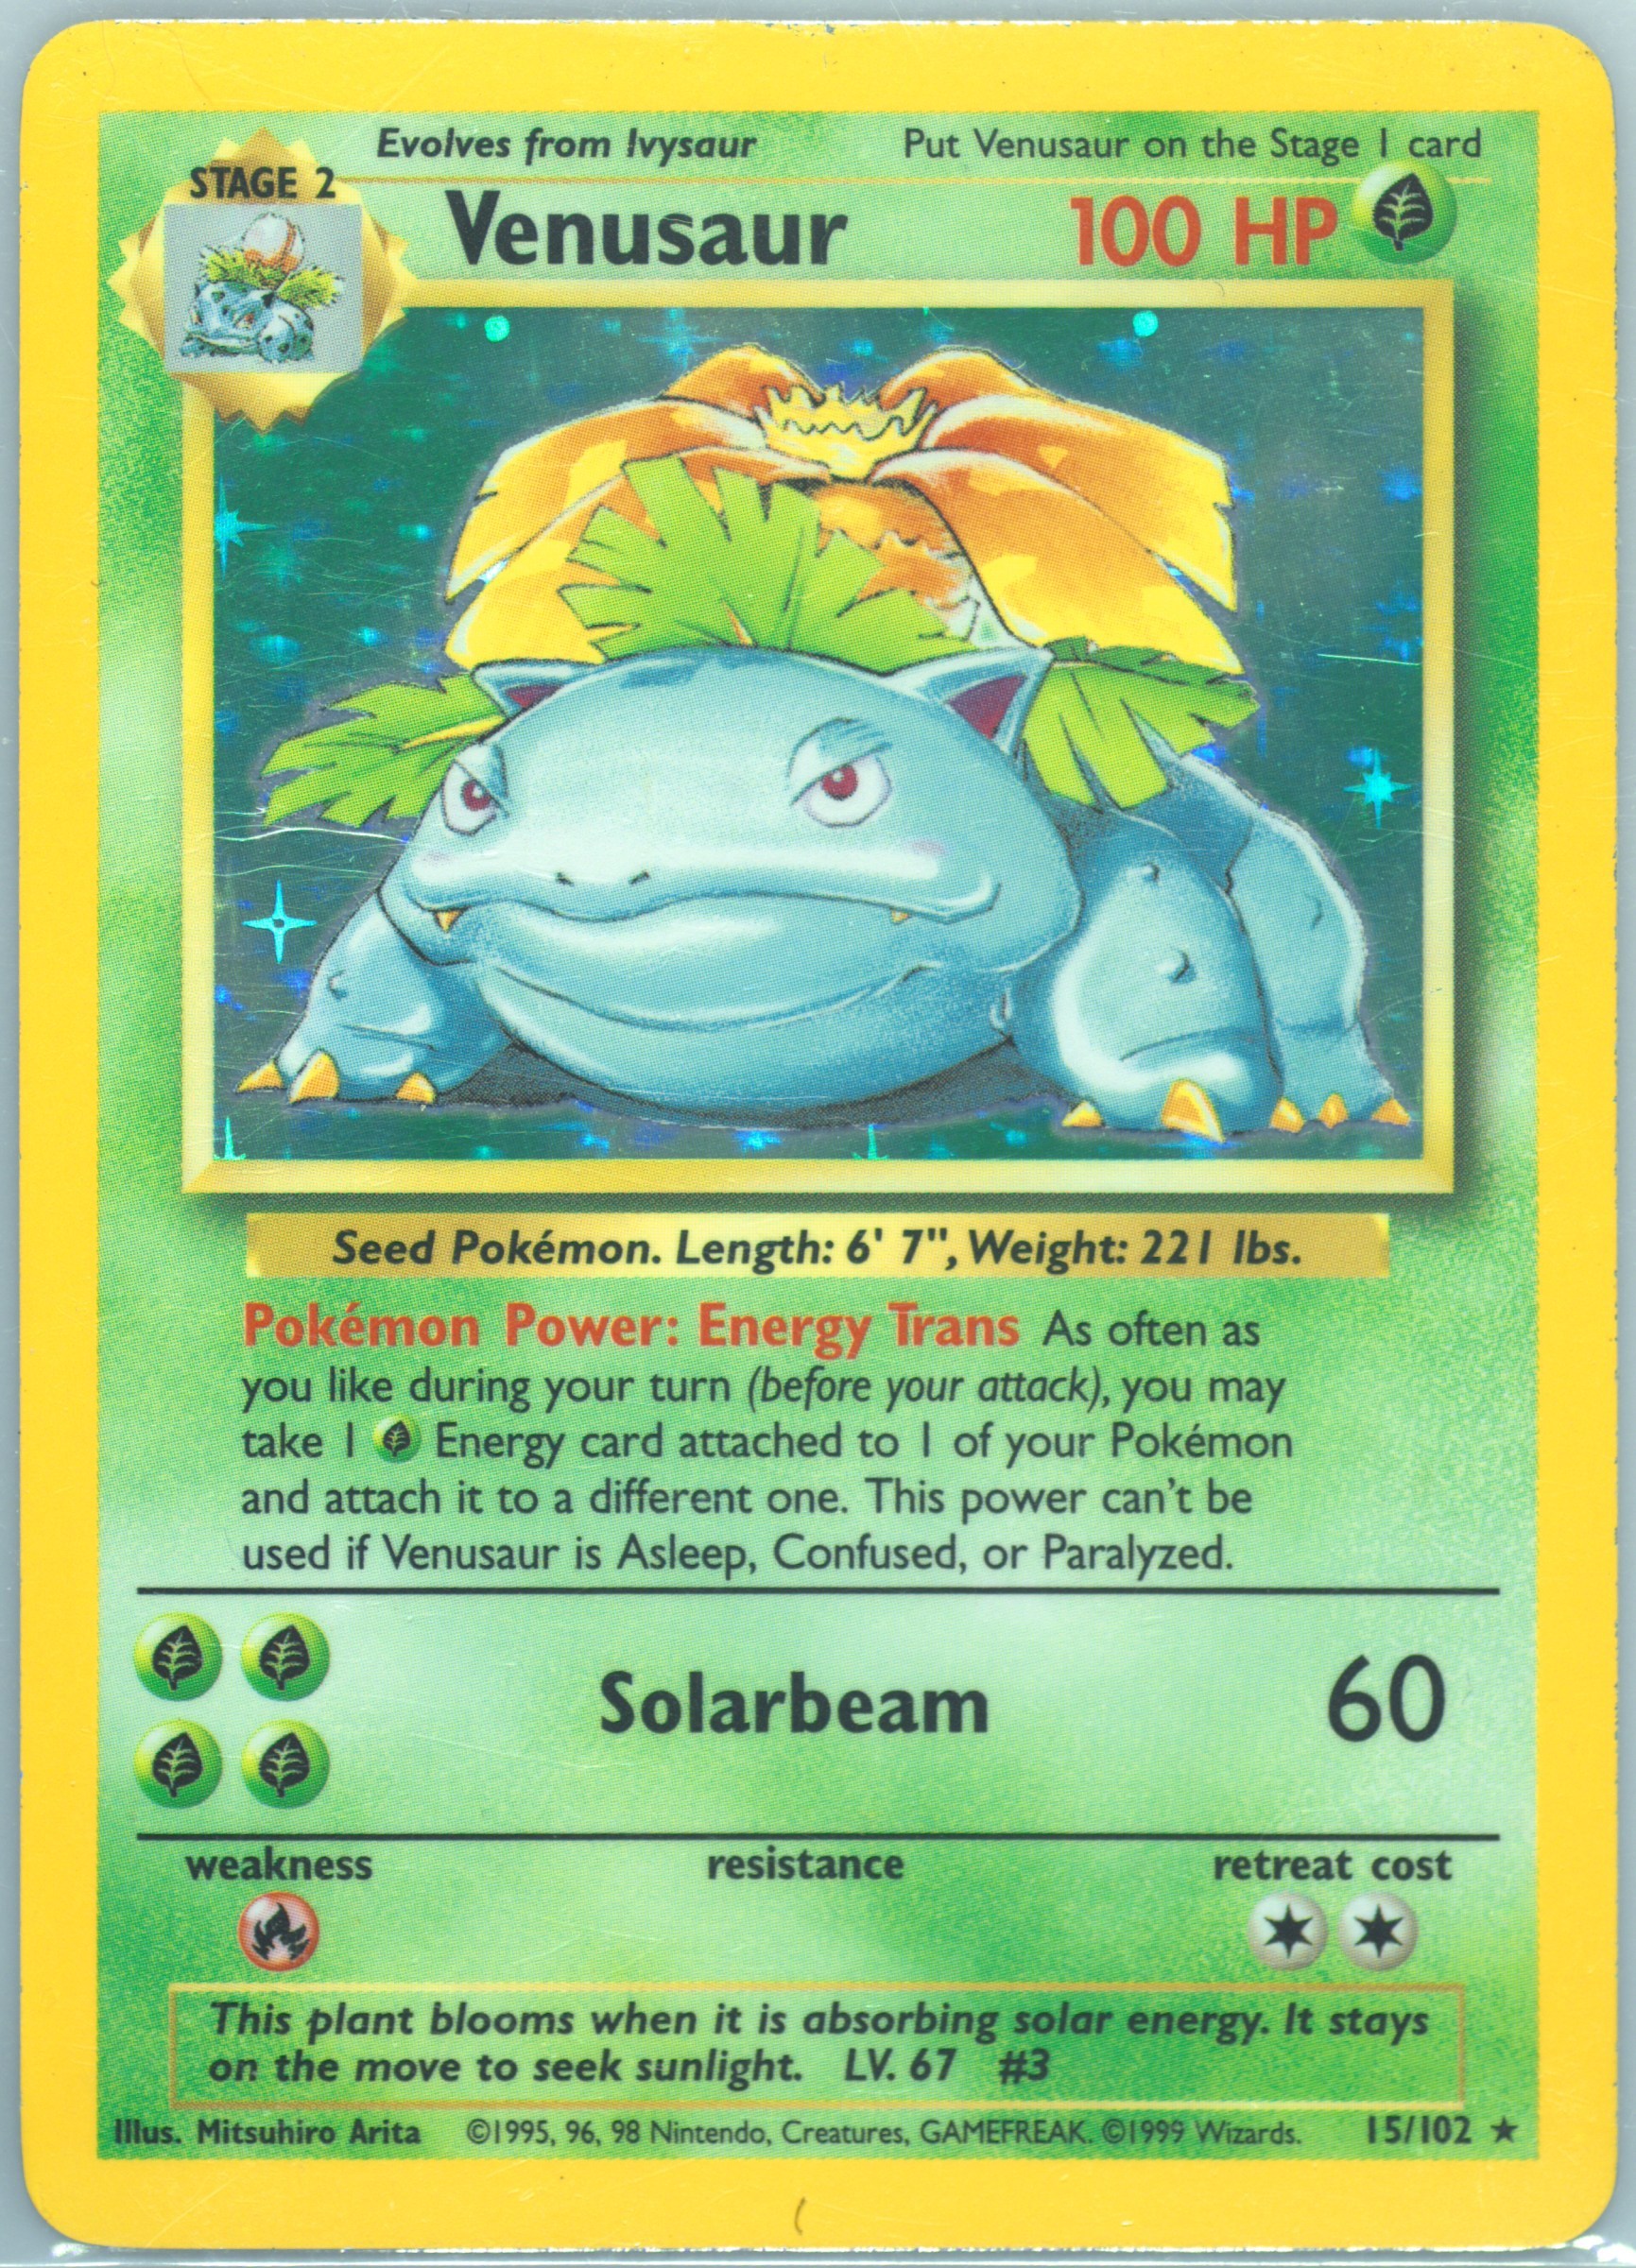
1999 Pokemon Game Base Set Unlimited Venusaur Holo Rare 15/102 #15 PSA 9 MINT
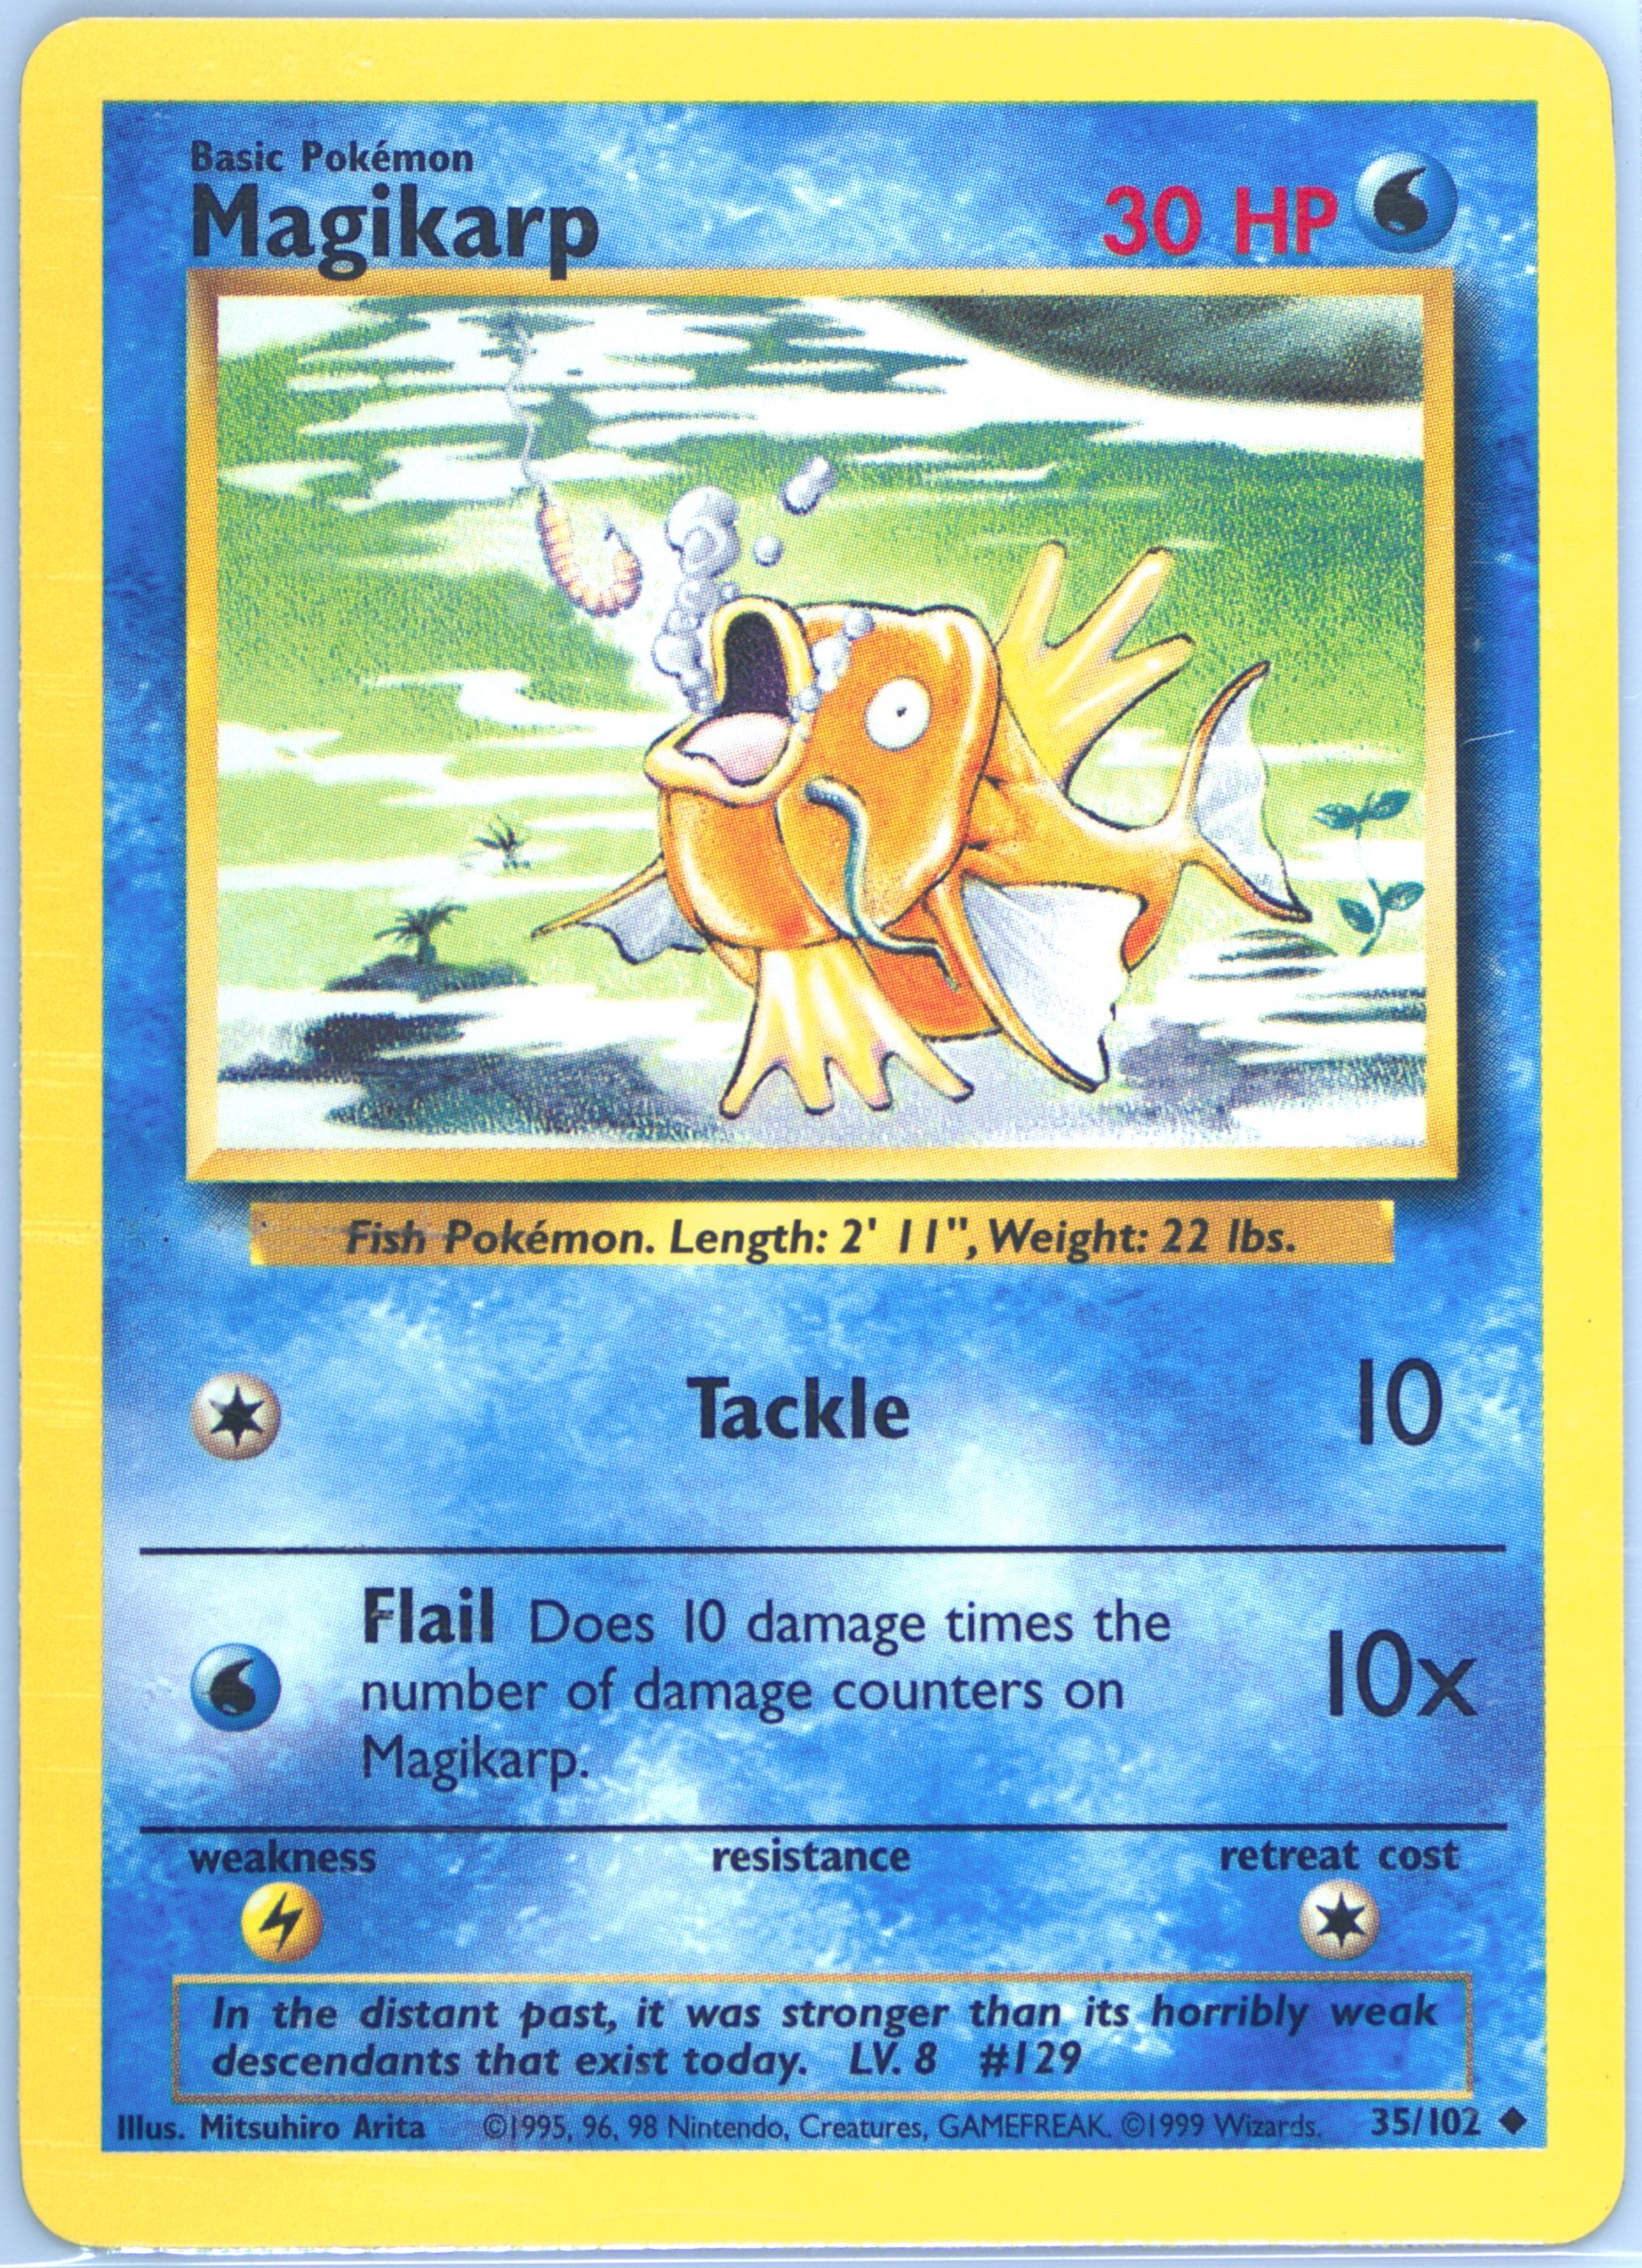
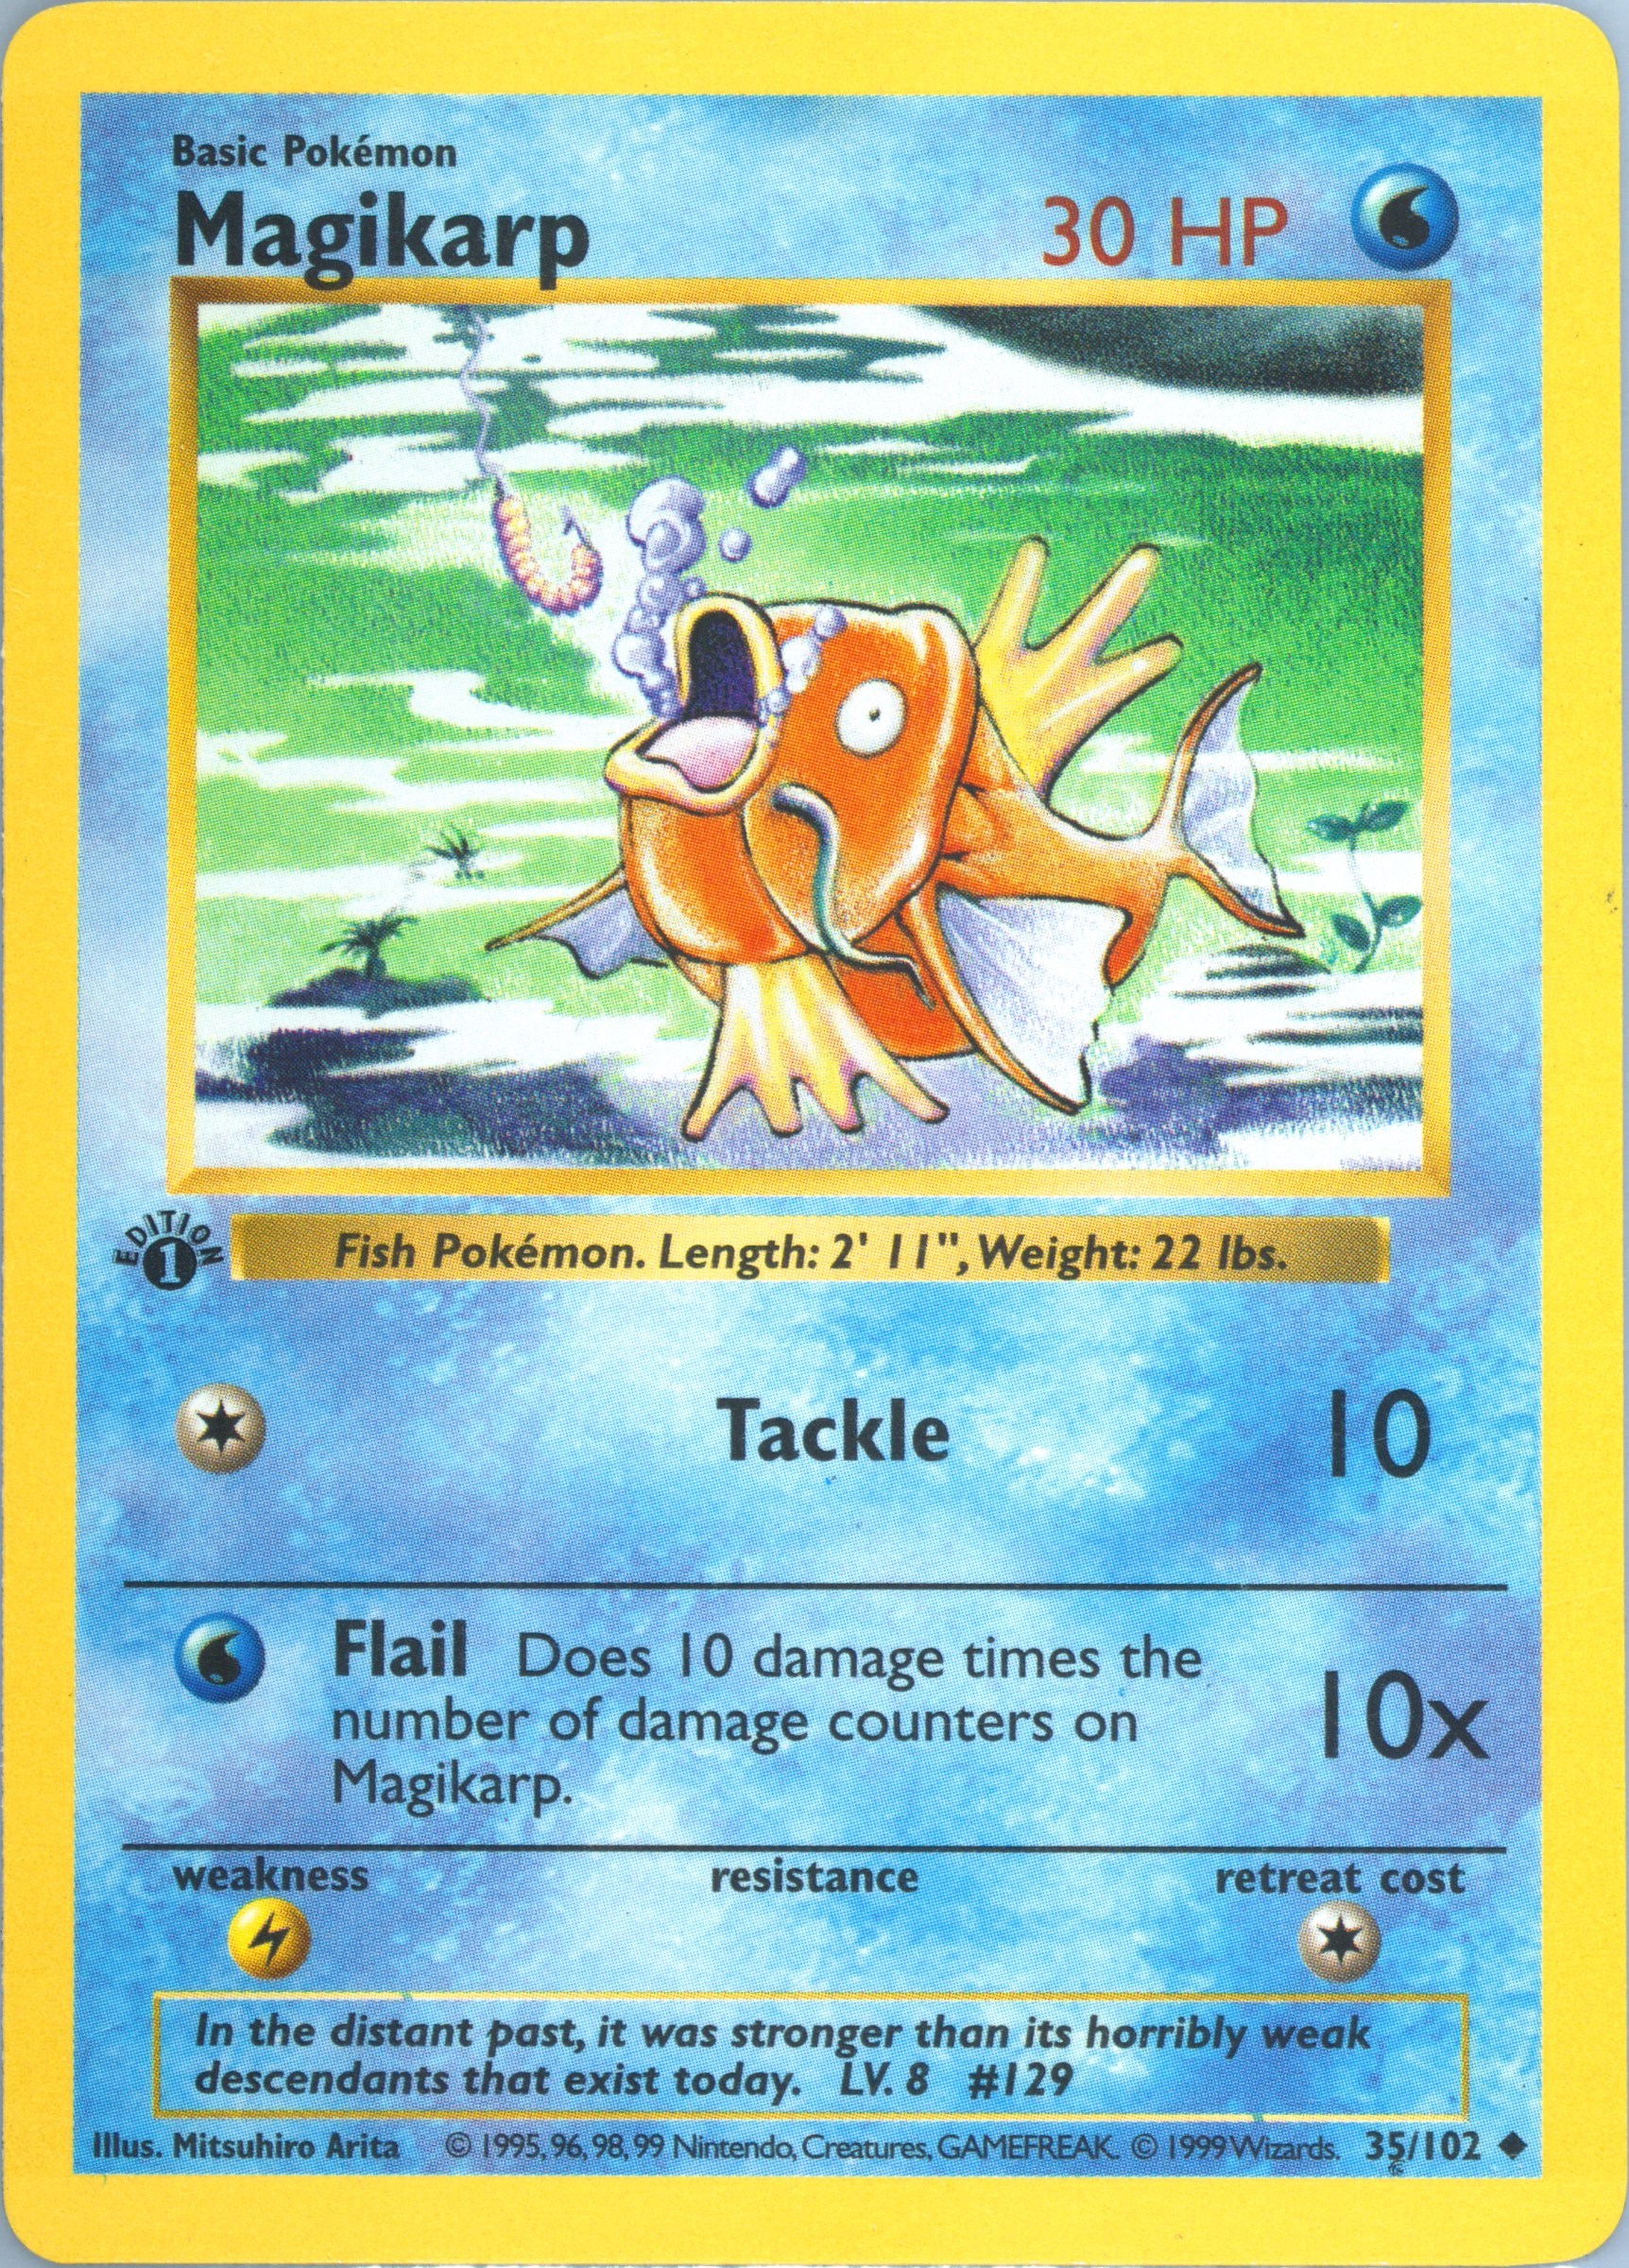
1999 Pokémon Base Set Unlimited 35/102 Magikarp PSA 9
VENUSAUR EX 2023 POKEMON MEW EN SPECIAL ILLUSTRATION RARE #198/165 PSA 8 Q7261

PSA 10 Machoke #177/165 Illustration Rare 2023 Pokemon 151 MEW EN GEM MINT
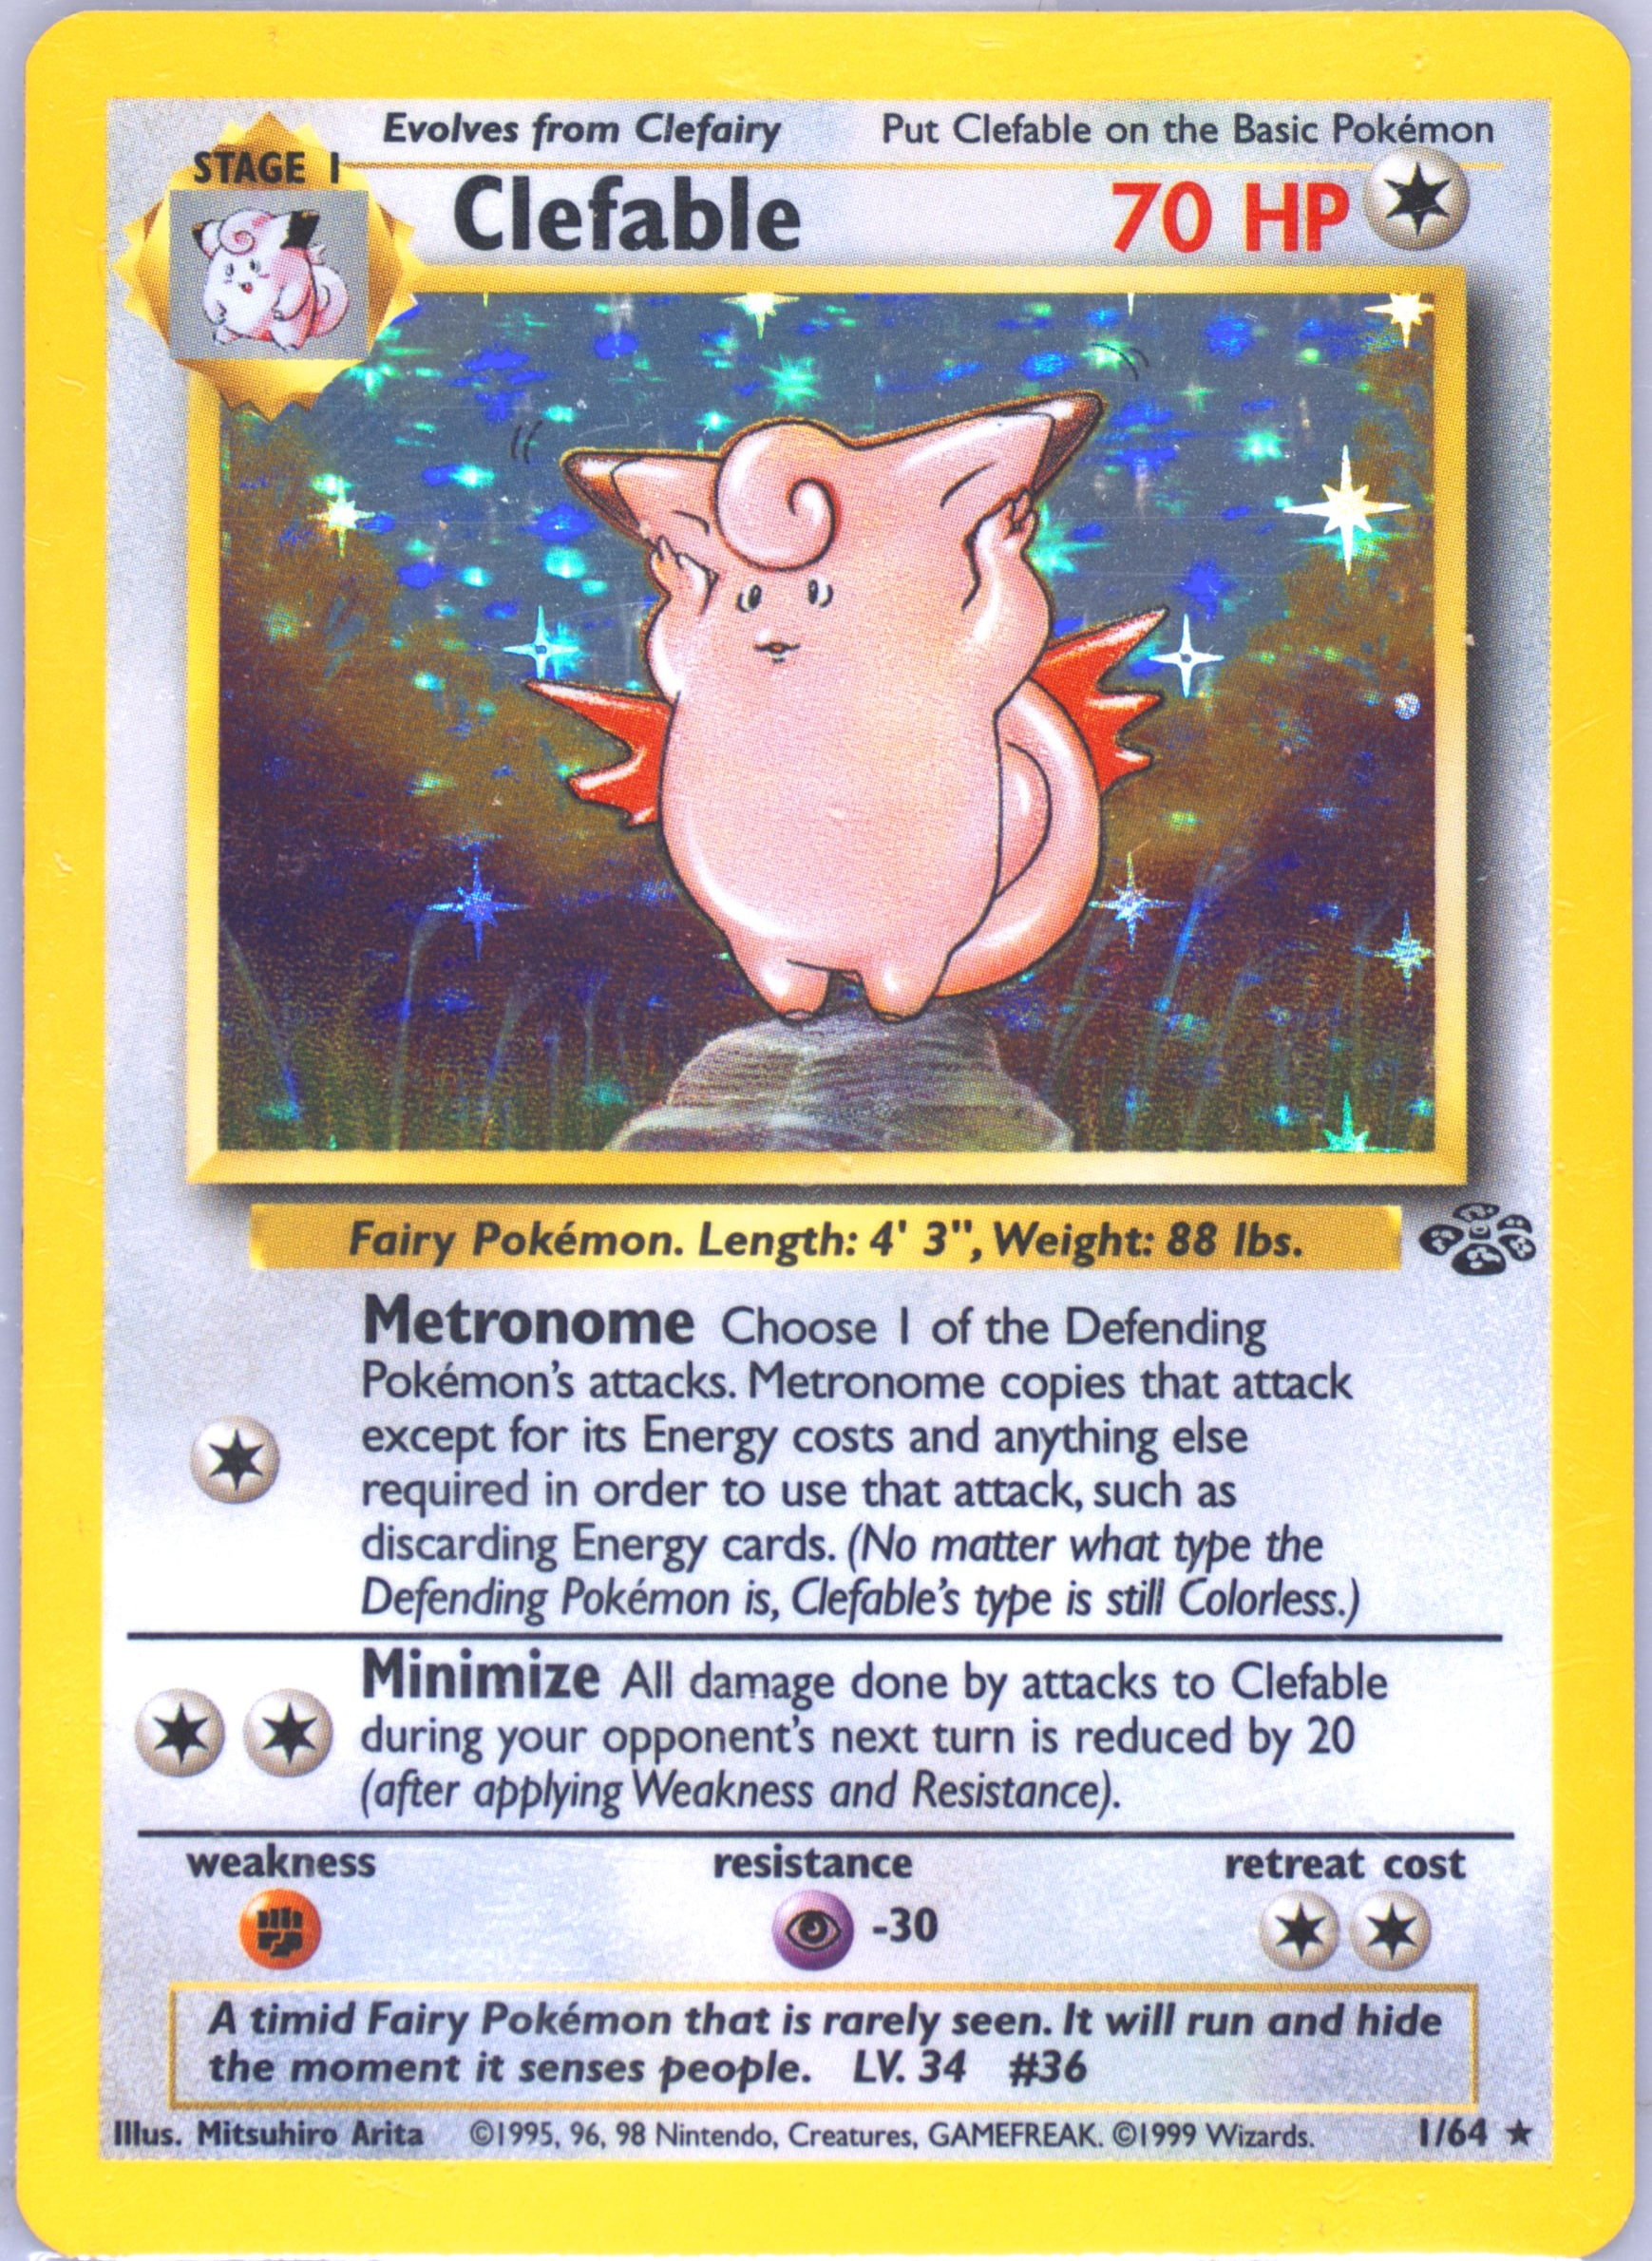
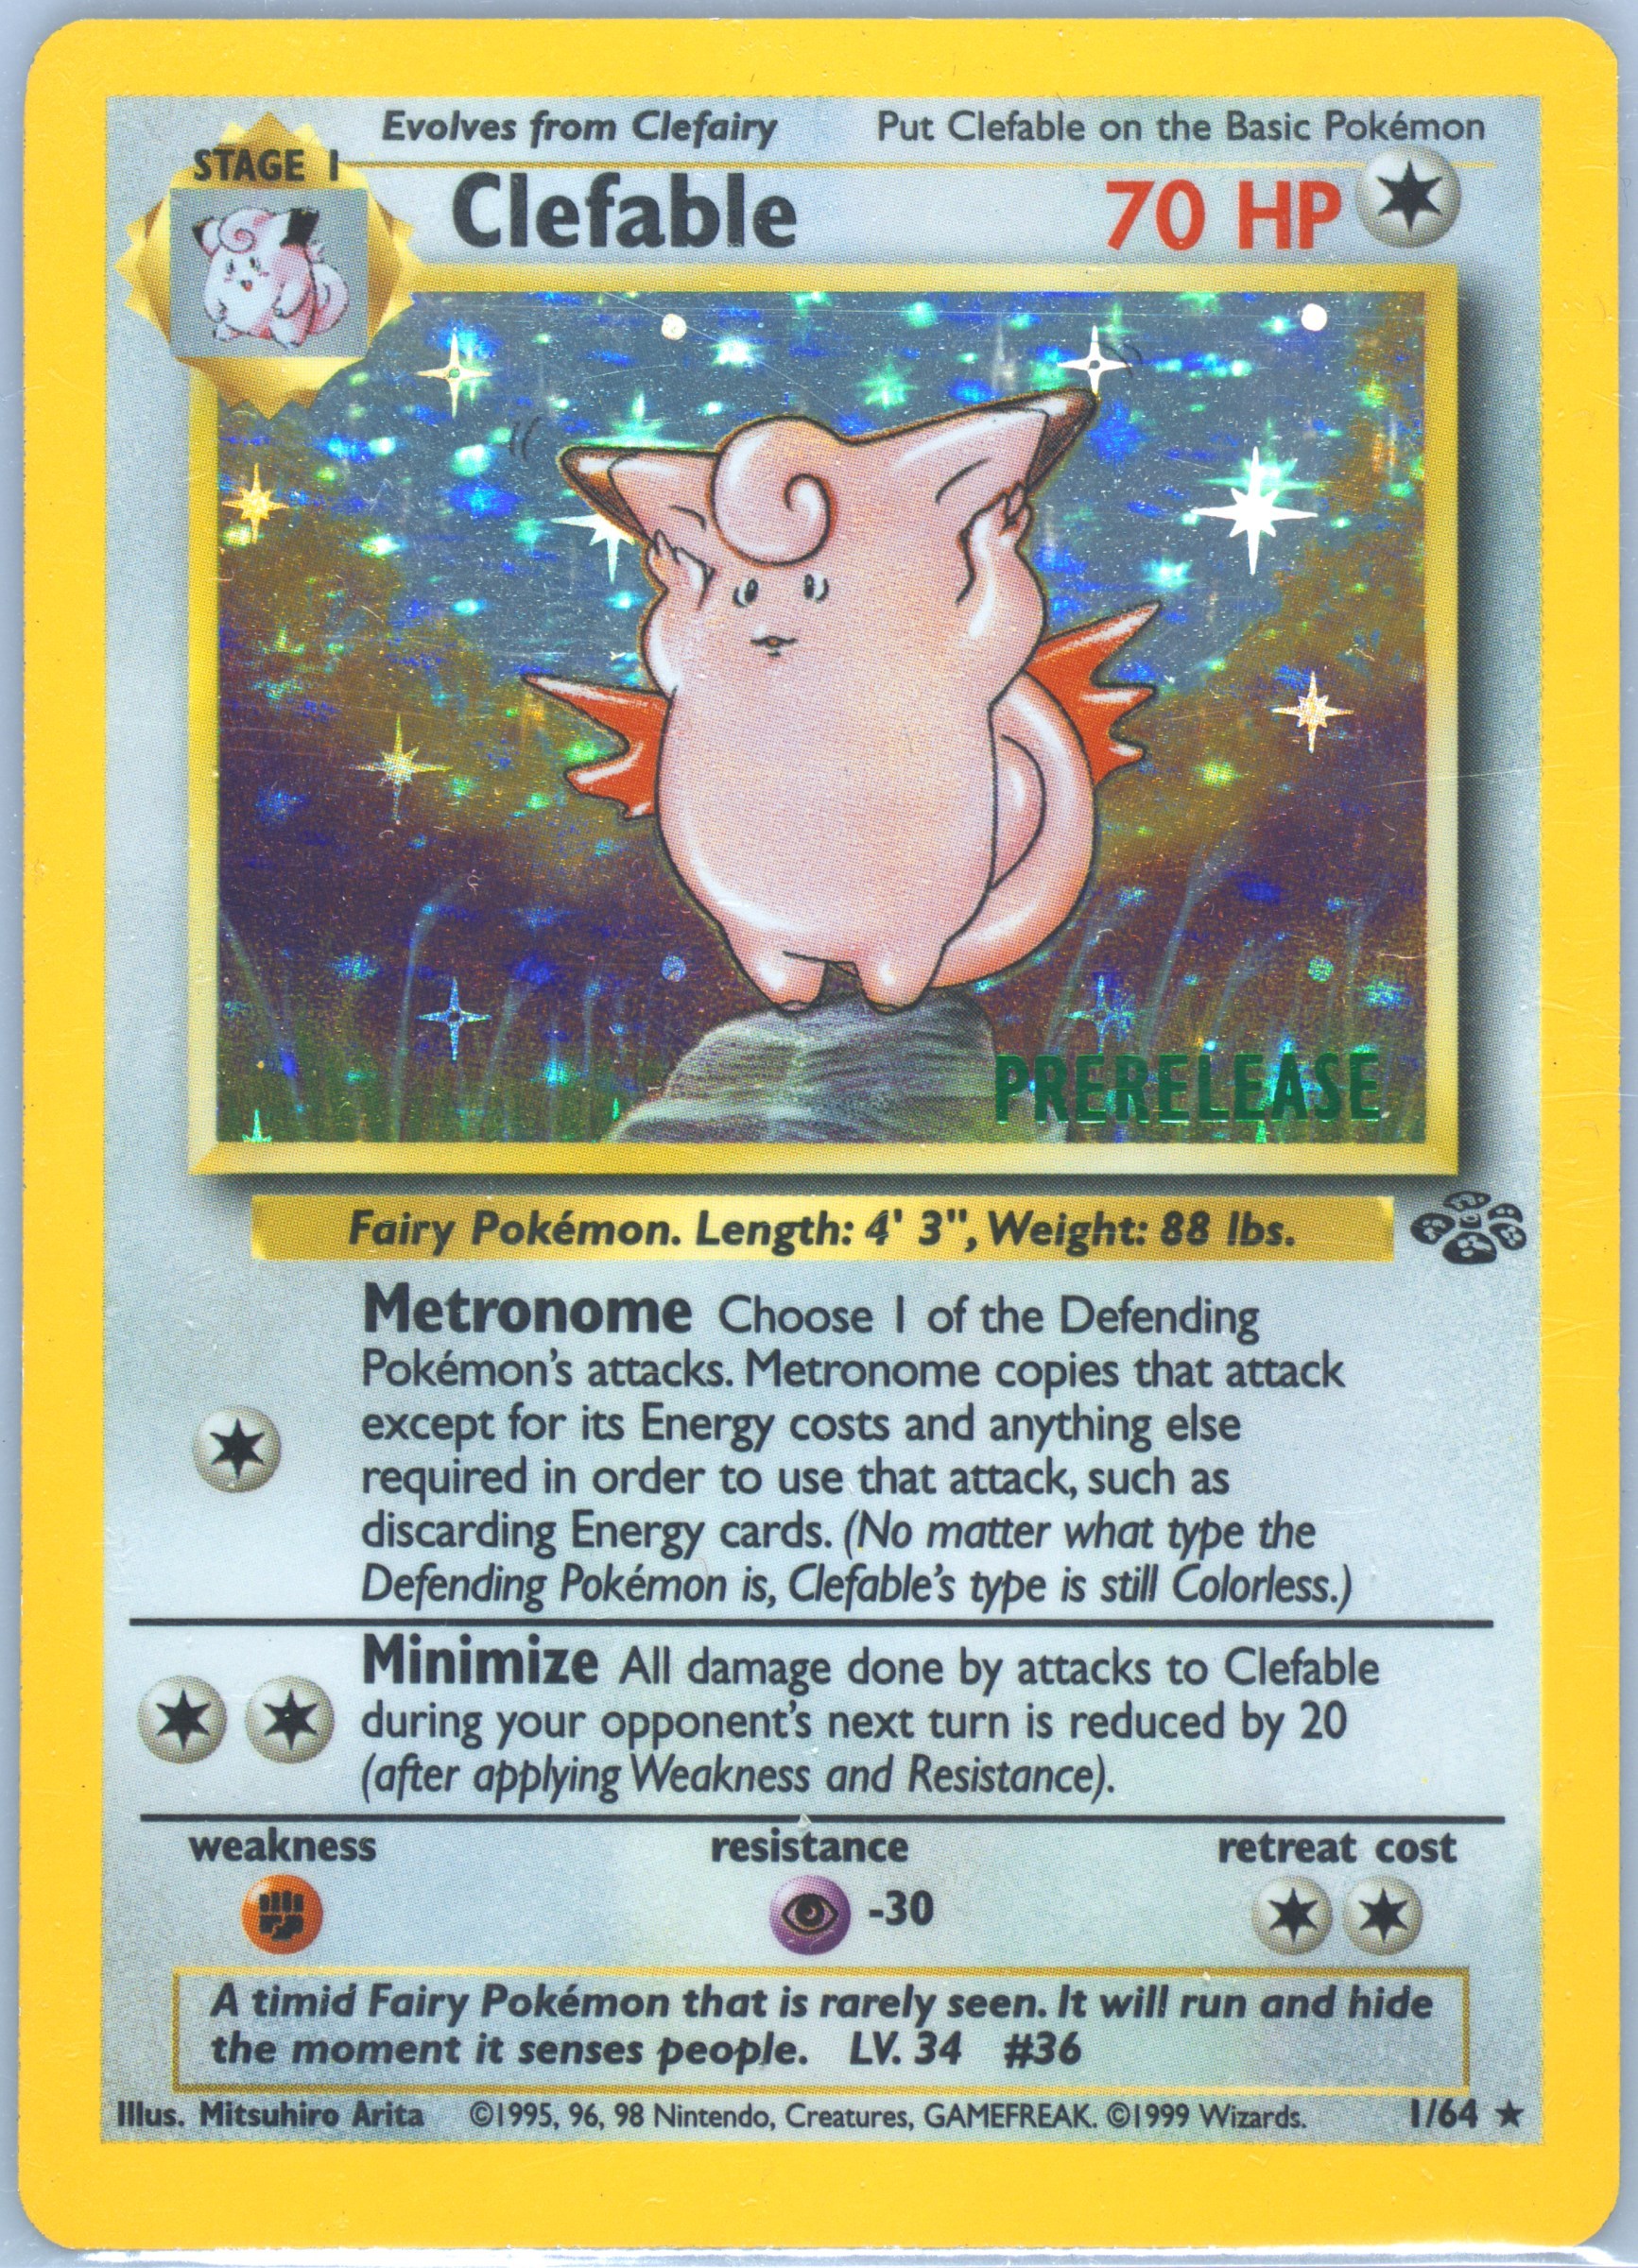
1999 WOTC POKEMON JUNGLE UNLIMITED CLEFABLE 1/64 HOLO RARE PSA 9 MINT
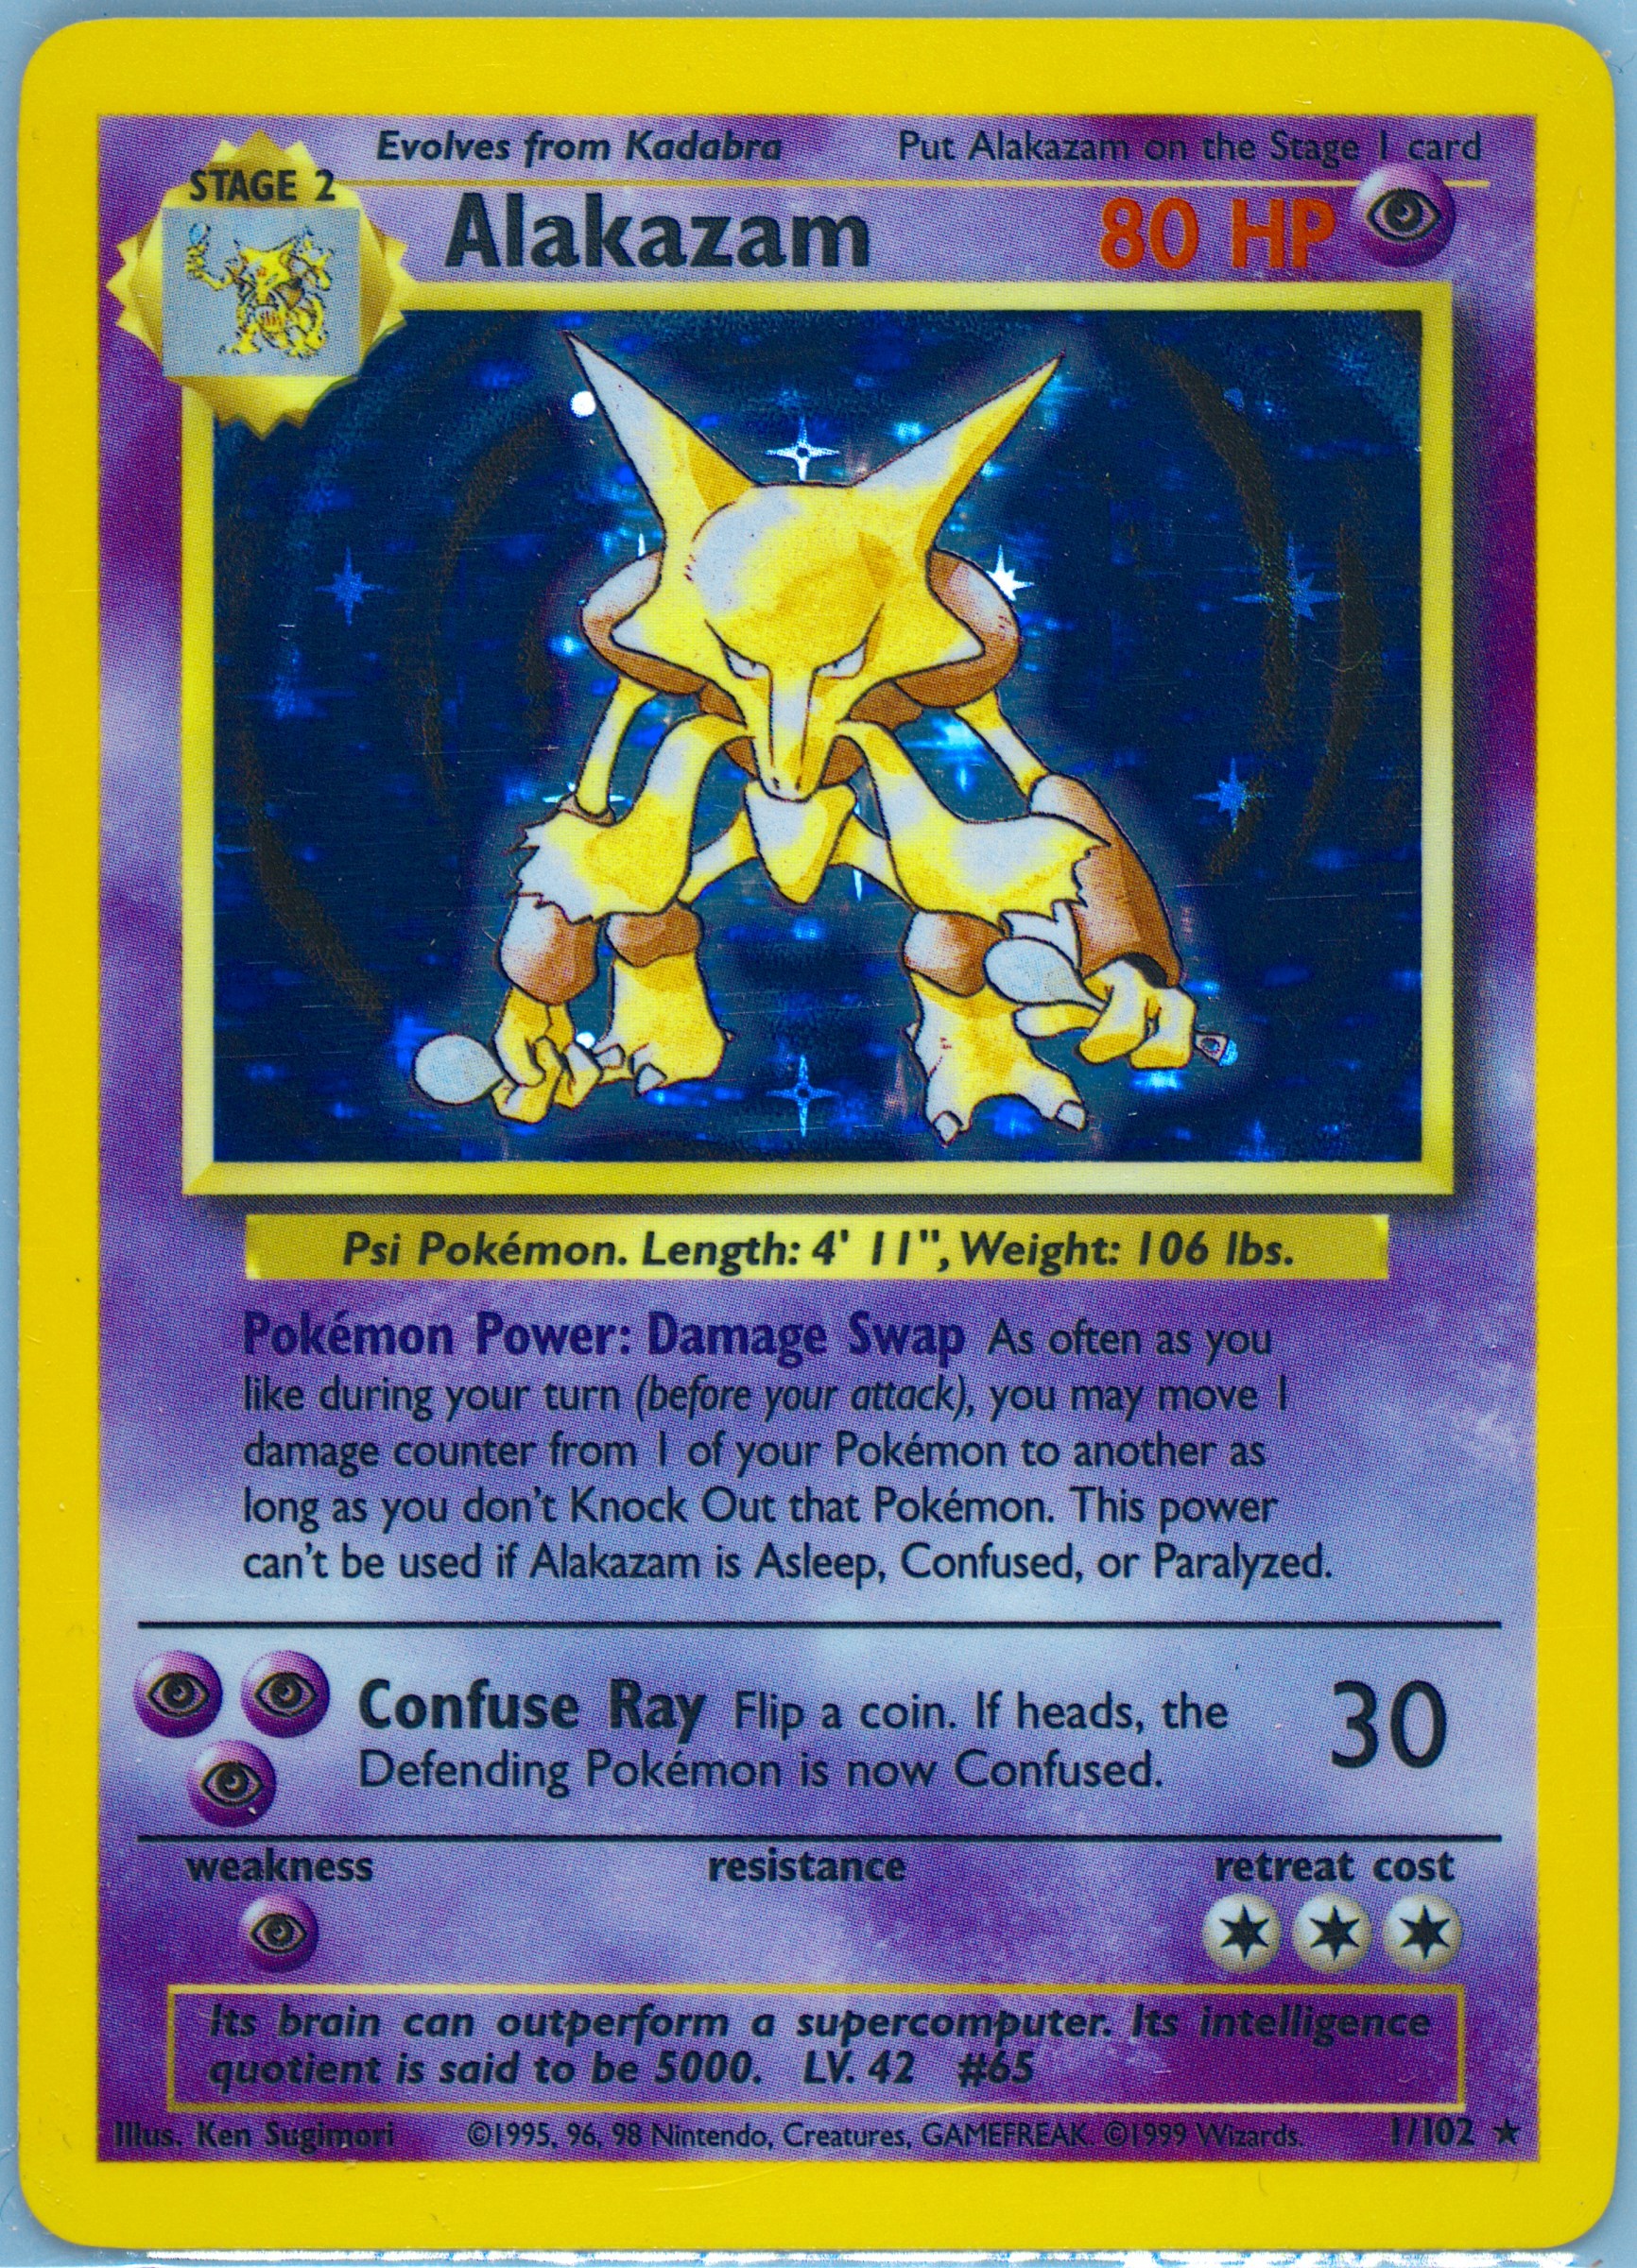
Pokémon TCG Alakazam Base Set 1/102 Holo Unlimited Holo Rare Psa 7
2023 Pokemon SV 151 Squirtle Illustration Rare 170/165 Holo PSA 10 English
1999 WOTC POKEMON JUNGLE UNLIMITED VENOMOTH 13/64 HOLO RARE FOIL PSA 9 MINT
1999 WOTC POKEMON GAME BASE SET UNLIMITED ALAKAZAM #1/102 HOLO RARE PSA 7
2023 POKEMON TCG MEW EN 151 VENUSAUR EX #182/165 ULTRA RARE HOLO PSA 10 GEM MT
Affiliate links — TCGBerg may earn a commission on purchases made through these listings.
The biggest moves in TCGBerg fair value across the tracked universe.
Every tracked mover by 30d move and market cap, sized by confidence. Top-right is large and rising; extreme moves pin to the edge. Click any point to open the card.
Where the market's capital concentrates: the richest tracked atoms by implied slabbed market cap.
| # | Atom | Set | Grade | Market cap | Share | Conf |
|---|---|---|---|---|---|---|
| 1 | Charizard ex #199Holo | 151 | PSA10 | $44.63M | 5.6% | 97 |
| 2 | Charizard #41st Edition Shadowless | Base Set | PSA9 | $29.12M | 3.7% | 66 |
| 3 | Charizard #4Unlimited | Base Set | PSA9 | $28.08M | 3.5% | 88 |
| 4 | Charizard #41st Edition Shadowless | Base Set | PSA8 | $21.26M | 2.7% | 66 |
| 5 | Charizard ex #199Holo | 151 | PSA9 | $20.52M | 2.6% | 97 |
| 6 | Charizard #4Unlimited | Base Set | PSA8 | $20.35M | 2.6% | 97 |
| 7 | Charizard #41st Edition Shadowless | Base Set | PSA6 | $16.08M | 2.0% | 73 |
| 8 | Charizard #41st Edition Shadowless | Base Set | PSA7 | $14.16M | 1.8% | 62 |
The strongest-performing TCGBerg indices over the last 30 days, the benchmark view of the market.
| Index | Value | 30d | YTD | Trend |
|---|---|---|---|---|
| 151 · Reverse Holo · PSA 10 151 · Reverse Holo | 283.35 | 187.2% | 1.8% | |
| 151 · Reverse Holo · Composite 151 · Reverse Holo | 254.32 | 157.2% | 1.6% | |
| Jungle · Holo · PSA 10 Jungle · Holo | 183.24 | 83.2% | 83.2% | |
| Jungle · Holo · Composite Jungle · Holo | 181.19 | 81.2% | 81.2% | |
| Jungle · Holo · PSA 7 Jungle · Holo | 180.60 | 80.9% | 80.6% | |
| 151 · Reverse Holo · PSA 9 151 · Reverse Holo | 170.14 | 71.2% | 0.5% | |
| Jungle · Holo · PSA 8 Jungle · Holo | 171.84 | 71.0% | 71.8% | |
| 151 · Normal · PSA 10 151 · Normal | 137.86 | 37.9% | 37.9% |
The full gainers and losers board, ranked by fair-value move across every tracked atom.
ExploreThe tracked universe by implied market cap, broken down by set, grade, and print run.
ExploreEvery set we track, ranked by total market cap with population, confidence, and momentum.
ExploreContinuous-divisor benchmarks that track whole sets and segments over time.
Explore